Ecosystems & Conservation Decisions — Chapter Practice, Grade 10
Analyze populations, food webs, cycles, disturbance, and evidence for conservation designs.
Problem 1
- community
- biome
- trophic level
- population
Answer and explanation
population
A population is one species in one area; a community is all the different populations together.
Problem 2
Answer and explanation
3200 cells
N = 200 × 2⁴ = 200 × 16 = 3,200 cells.
Problem 3
- the carrying capacity
- twice the carrying capacity
- an ever-increasing value
- zero
Answer and explanation
the carrying capacity
Logistic growth flattens out at the carrying capacity (K), where birth and death rates roughly balance.
Problem 4
- commensalism
- parasitism
- competition
- mutualism
Answer and explanation
parasitism
In parasitism one species benefits (the tapeworm) at the direct expense of the other (the dog).
Problem 5
Answer and explanation
A density-dependent limiting factor grows stronger as a population becomes more crowded — for example, competition for food, disease, or predation. A density-independent limiting factor affects a population regardless of its density — for example, a hard freeze, a flood, or a wildfire. Density-dependent factors tend to pull a population back toward its carrying capacity, while density-independent factors can strike no matter how sparse or crowded the population is.
Problem 6
Answer and explanation
215 individuals under the stated accounting.
Net change=30+10−20−5=15.
New size=200+15=215.
Response criteria
- Use the stated conditions.
- Show the evidence or calculation.
- Explain the conclusion and any stated limitation.
Problem 7
Hints
Include both migration flows, not just births and deaths.
Answer and explanation
−15 individuals.
Problem 8
Hints
State what the supplied observations or conditions establish, and separate that from any assumption.
Answer and explanation
Transmission may increase with crowding, while a storm can affect populations regardless of density, depending on the event.
Problem 9
Answer and explanation
More individuals can experience the same per-individual risk; density dependence concerns how that risk or effect changes with density.
A density-dependent effect changes per-individual impact with density, as selected competition or infection processes can. A density-independent event can affect abundance without that same dependence, though its final consequences still interact with conditions. A storm killing organisms does not automatically create feedback that restores a fixed population. Define the per-individual effect and compare densities under matched conditions. Changes in total losses can occur simply because more individuals are exposed even when the per-individual rate is unchanged.
More individuals can experience the same per-individual risk; density dependence concerns how that risk or effect changes with density.
Response criteria
- Read the structures, axes, directions and units correctly.
- Connect the evidence with the biological mechanism.
- Respect stated model assumptions and distinguish an observation from a further inference.
Problem 10
Answer and explanation
Final count is 80+20−12+9−5 = 92. Change is +12, or 12/80×100 = 15%, under the stated boundary and interval.
Final count is 80+20−12+9−5 = 92. Change is +12, or 12/80×100 = 15%, under the stated boundary and interval.
Response criteria
- Use the stated measurements or conditions, with correct units.
- Connect the result to the biological mechanism or evidence relationship.
- Identify the assumption, model limit or further evidence requested.
Problem 11
Answer and explanation
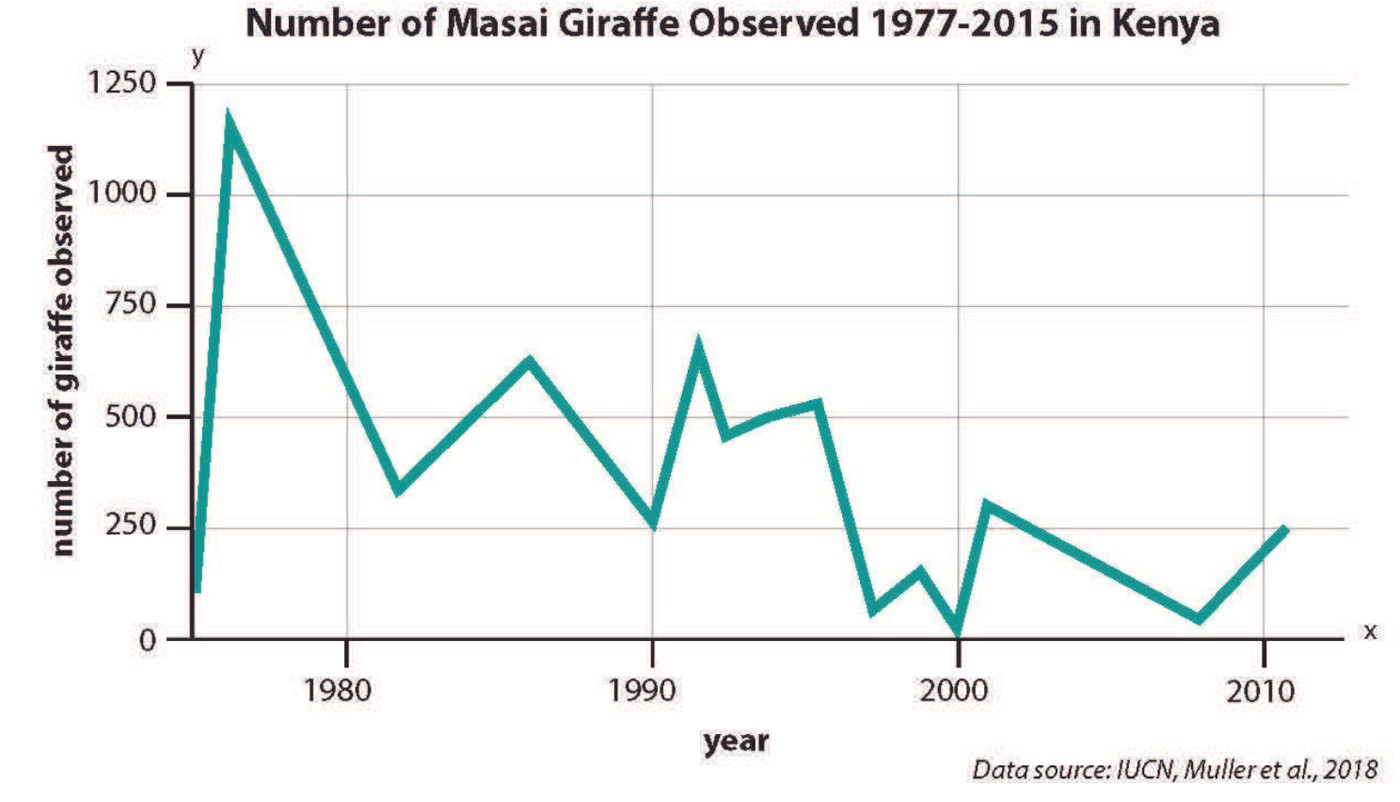
The high early peak exceeds 1,000 observed giraffes, while most later plotted counts are much lower. The record is not monotonic: a valid rise occurs just after the very low count near 2000. Trend descriptions depend on the chosen endpoints, so the early peak-to-later decline is not a claim that every possible interval declines. Neither a rise nor a decline isolates causality. Comparable survey area/effort, detection methods, dates/season and habitat or population movement information help interpret the counts.
Read the named organism, region, years and count axis.
Compare both a long interval and a specific rising segment rather than choose one convenient section.
Request sampling/detection and biological context before assigning a cause.
Response criteria
- Compare the high early peak with later values, identify a rising segment and explain why endpoint choice matters.
- Retain the organism/region/interval and observed-count meaning.
- State two relevant monitoring details and a causal limitation.
Problem 12
- primary consumer
- decomposer
- autotroph
- heterotroph
Answer and explanation
autotroph
Autotrophs (producers) build their own food, usually through photosynthesis; heterotrophs must consume other organisms.
Problem 13
Answer and explanation
6000 kcal
60,000 × 0.10 = 6,000 kcal.
Problem 14
Answer and explanation
60 kcal
600 × 0.10 = 60 kcal.
Problem 15
- Producers
- Primary consumers
- Secondary consumers
- Top predators
Answer and explanation
Top predators
Energy is lost at every step, so the top predators at the peak have the least energy available.
Problem 16
Answer and explanation
When cattle eat grain, about 90% of the grain's energy is used for the cattle's own life processes or lost as heat, so only about 10% is stored as beef for people to eat. Eating the grain directly skips that lossy step, so far more of the field's captured energy actually reaches people — meaning the same land can feed many more of them.
Problem 17
Answer and explanation
1200 kJ under the supplied efficiency; remaining energy is not all converted into one identical output.
Convert 15% to 0.15.
8000×0.15=1200 kJ.
Response criteria
- Use the stated conditions.
- Show the evidence or calculation.
- Explain the conclusion and any stated limitation.
Problem 18
Hints
Production transferred is only part of the total consumed-energy account.
Answer and explanation
2000×0.08=160 kJ.
Problem 19
Hints
State what the supplied observations or conditions establish, and separate that from any assumption.
Answer and explanation
They represent transfer of matter and energy to the consumer; check the diagram's stated convention.
Problem 20
Answer and explanation
No. Standing stock differs from production/transfer rate; rapid producer turnover and the stated time boundary matter.
Standing biomass is material present at one time; production is new material per time. A producer community can turn over rapidly, sustaining consumers while its instantaneous mass remains relatively small, as some aquatic comparisons show. Pyramids of numbers can also invert when many consumers depend on a few large producers. A conventional energy-transfer pyramid uses matched rates and boundaries, not the same snapshot quantity. Distinguish stocks, rates and organism counts before declaring a diagram impossible or generalizing to every system.
No. Standing stock differs from production/transfer rate; rapid producer turnover and the stated time boundary matter.
Response criteria
- Read the structures, axes, directions and units correctly.
- Connect the evidence with the biological mechanism.
- Respect stated model assumptions and distinguish an observation from a further inference.
Problem 21
Answer and explanation
The outputs are 1,200 kJ and 96 kJ. The stated transfer fractions define this comparison; ten percent is an approximation, not a compulsory constant.
The outputs are 1,200 kJ and 96 kJ. The stated transfer fractions define this comparison; ten percent is an approximation, not a compulsory constant.
Response criteria
- Use the stated measurements or conditions, with correct units.
- Connect the result to the biological mechanism or evidence relationship.
- Identify the assumption, model limit or further evidence requested.
Problem 22
- Photosynthesis
- Nitrogen fixation
- Combustion
- Cellular respiration
Answer and explanation
Photosynthesis
Photosynthesis absorbs carbon dioxide and builds it into sugars inside producers.
Problem 23
- breaks nitrates down into nitrogen gas
- converts nitrogen gas into a form plants can absorb
- releases carbon dioxide into the atmosphere
- turns liquid water into vapor
Answer and explanation
converts nitrogen gas into a form plants can absorb
Nitrogen fixation, done mainly by bacteria, converts unusable N₂ gas into ammonia and nitrates that plants can take up.
Problem 24
Answer and explanation
390 mL
500 × 0.78 = 390 mL of nitrogen gas.
Problem 25
- condensation
- precipitation
- transpiration
- runoff
Answer and explanation
transpiration
Transpiration is water evaporating from plant leaves; it is a major source of atmospheric water vapor.
Problem 26
Answer and explanation
The fertilizer adds extra nitrogen and phosphorus to the lake, which fuels an explosive bloom of algae. When the algae die, decomposer bacteria break them down and use up much of the dissolved oxygen in the water. With the oxygen depleted, fish and other aquatic animals suffocate. This process is called eutrophication.
Problem 27
Answer and explanation
Nutrient enrichment can promote blooms followed by oxygen depletion, depending on conditions.
Added nutrients can stimulate producer growth under limiting conditions.
Decomposition of added organic matter consumes oxygen faster than it is replenished.
Response criteria
- Use the stated conditions.
- Show the evidence or calculation.
- Explain the conclusion and any stated limitation.
Problem 28
Hints
Nutrients do not directly become oxygen depletion without a mechanism.
Answer and explanation
The reservoir is a stored amount; the input is a rate. They cannot be compared as the same quantity.
Problem 29
Hints
State what the supplied observations or conditions establish, and separate that from any assumption.
Answer and explanation
Atoms are reused among stores, while usable energy disperses and must be replenished.
Problem 30
Answer and explanation
The appropriate chemical transformation and uptake pathway are needed; atmospheric abundance and usable form differ.
Nitrogen fixation converts atmospheric N₂ into forms that can enter biological nitrogen use. Nitrification and denitrification are different microbial transformations; denitrification can return nitrogen to gaseous forms under suitable conditions. Many plants take up nitrogen compounds rather than directly using N₂, with some relying on microbial associations. Availability depends on pathways, soil/water conditions and transport, not only the total nitrogen nearby. A diagram should trace compound forms and mechanisms rather than assign every microbial process the word fixation.
The appropriate chemical transformation and uptake pathway are needed; atmospheric abundance and usable form differ.
Response criteria
- Read the structures, axes, directions and units correctly.
- Connect the evidence with the biological mechanism.
- Respect stated model assumptions and distinguish an observation from a further inference.
Problem 31
Answer and explanation
The final store is 50+4×(12−9)=62 units. Twelve units/year is an input flux, not the stock or net annual gain; the net gain is three units/year.
The final store is 50+4×(12−9)=62 units. Twelve units/year is an input flux, not the stock or net annual gain; the net gain is three units/year.
Response criteria
- Use the stated measurements or conditions, with correct units.
- Connect the result to the biological mechanism or evidence relationship.
- Identify the assumption, model limit or further evidence requested.
Problem 32
- Collecting animals for zoos
- Too many decomposers
- Volcanic eruptions
- Habitat loss and fragmentation
Answer and explanation
Habitat loss and fragmentation
Destroying and fragmenting habitat removes the places species need to live and is the biggest driver of biodiversity loss.
Problem 33
- absorb and re-radiate heat that would otherwise escape to space
- block sunlight from ever reaching Earth's surface
- cool the atmosphere by releasing oxygen
- destroy the ozone layer directly
Answer and explanation
absorb and re-radiate heat that would otherwise escape to space
Greenhouse gases let sunlight in but trap outgoing heat (infrared), re-radiating some of it back toward the surface and warming it.
Problem 34
Answer and explanation
2 ppm
0.02 × 10 × 10 = 2 ppm.
Problem 35
- Native species immediately go extinct on their own
- They arrive without the predators, diseases, and competitors that limited them back home
- They can survive without any energy source
- New ecosystems always have unlimited resources
Answer and explanation
They arrive without the predators, diseases, and competitors that limited them back home
Without their usual limiting factors, invasive populations can grow explosively and outcompete native species.
Problem 36
Answer and explanation
A personal action is reducing, reusing, and recycling, which cuts the demand for raw materials and energy and lessens pollution and habitat destruction from extracting new resources. A societal action is shifting from fossil fuels to renewable energy like solar and wind, which lowers greenhouse gas emissions and slows climate change. Both meet human needs while using resources at a rate ecosystems can sustain, protecting biodiversity for the future. (Other valid answers include protecting habitat, sustainable farming or fishing, and using less water or energy.)
Problem 37
Answer and explanation
Use is plausible; population recovery is not established by sightings alone.
Sightings suggest corridor use, but detectability and sampling effort matter.
Population growth needs independent abundance or reproduction evidence.
Response criteria
- Use the stated conditions.
- Show the evidence or calculation.
- Explain the conclusion and any stated limitation.
Problem 38
Hints
The success measure must match the conservation goal.
Answer and explanation
Different interventions address different mechanisms; connectivity does not necessarily reduce pollutant inputs.
Problem 39
Hints
State what the supplied observations or conditions establish, and separate that from any assumption.
Answer and explanation
Baseline, indicators, comparable methods, timing, uncertainty and criteria for revising the intervention.
Problem 40
Answer and explanation
Detection changed with the intervention period and can increase counts; comparable sampling or modeled correction is needed.
Detection probability is the chance of observing a present organism under a sampling method. A count can rise when effort, access, season or tools change even without equal population growth. An intervention evaluation needs baseline and follow-up measurements with suitable comparison sites and comparable methods. Before–after evidence establishes temporal order but does not alone isolate cause. Several indicators can reveal tradeoffs that one abundance measure hides, including condition, reproduction, habitat quality and unintended effects.
Detection changed with the intervention period and can increase counts; comparable sampling or modeled correction is needed.
Response criteria
- Read the structures, axes, directions and units correctly.
- Connect the evidence with the biological mechanism.
- Respect stated model assumptions and distinguish an observation from a further inference.
Problem 41
Answer and explanation
The raw count rises 50%, but changed detection can contribute. Use comparable effort/methods, suitable reference sites and repeated population/condition indicators; estimate detection where appropriate before attributing recovery.
The raw count rises 50%, but changed detection can contribute. Use comparable effort/methods, suitable reference sites and repeated population/condition indicators; estimate detection where appropriate before attributing recovery.
Response criteria
- Use the stated measurements or conditions, with correct units.
- Connect the result to the biological mechanism or evidence relationship.
- Identify the assumption, model limit or further evidence requested.
Problem 42
Answer and explanation
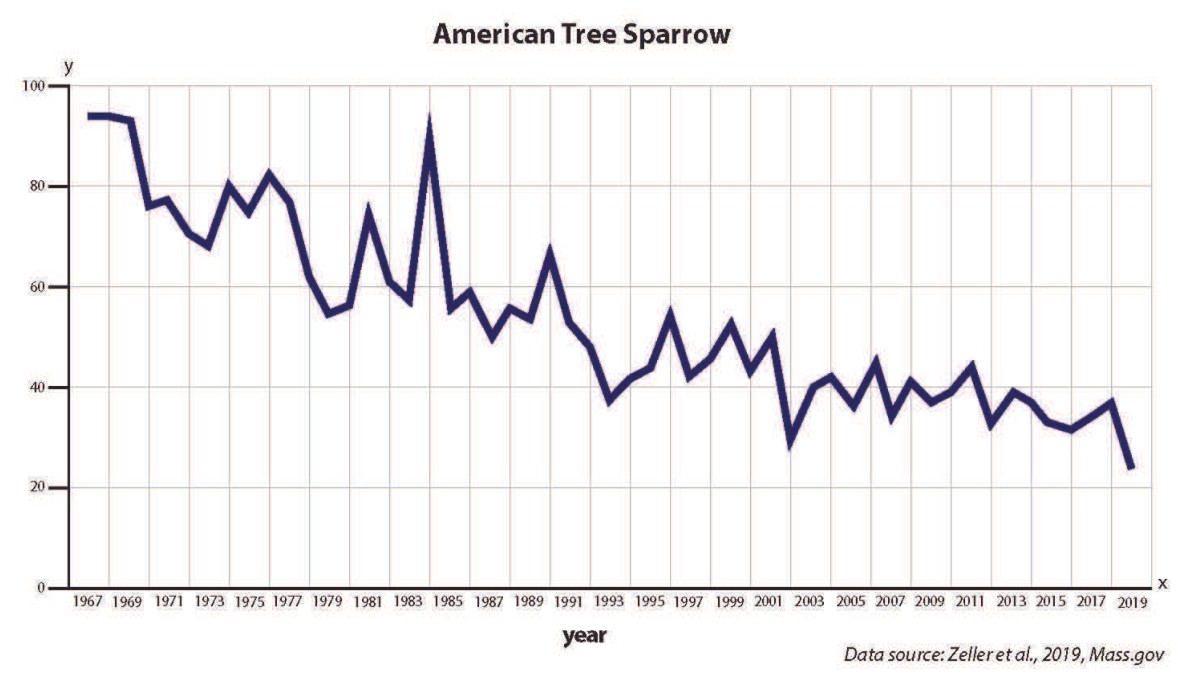
Acreage measures US land planted in millions of acres over 1997–2017; the bird indicator covers a longer selected historical period through 2019 and has no stated census/percentage unit. Their regions, methods and other conditions require clarification. Broad opposing patterns can motivate a habitat hypothesis, but matched local habitat/bird monitoring with comparable effort, relevant controls and alternative pressures would test causality more directly.
Keep land area separate from an abundance indicator.
Check years, area and method; do not convert the bird axis into percent without definition.
Propose comparable local surveys and control for detection/other pressures.
Response criteria
- Identify the different variables and periods.
- Do not invent a bird census or percentage unit.
- Explain causal limits and propose appropriate matched evidence.
Problem 43
Answer and explanation
30 percentage points
60 − 30 = 30; this differs from percent reduction.
Problem 44
- A time series and suitable comparison sites
- Only one decorative photo
- The species name alone
- A guaranteed endpoint
Answer and explanation
A time series and suitable comparison sites
Repeated and comparison evidence helps separate recovery from other changes.
Problem 45
Answer and explanation
Changes in herbivores can alter grazing, but other interactions may modify the response.
Problem 46
Answer and explanation
No; different indicators reveal different aspects of recovery.
Richness is one structural indicator.
Nutrient retention measures a different function and remains altered.
Response criteria
- Use the stated conditions.
- Show the evidence or calculation.
- Explain the conclusion and any stated limitation.
Problem 47
Hints
Define recovery operationally instead of assuming one universal measure.
Answer and explanation
Repeated abundance and feeding data, comparisons and mechanisms that rule out alternative resource or climate changes.
Problem 48
Hints
State what the supplied observations or conditions establish, and separate that from any assumption.
Answer and explanation
The second may arrive before populations, soils or resources recover, altering thresholds and trajectories.
Problem 49
Answer and explanation
A changes from 100 to 20, then returns to 100 by year four; B changes less but has not returned in that interval.
Resistance describes how little a system changes during a specified disturbance. Recovery describes return of selected properties afterward. Resilience is used in several related ways, so define the sense and measured variable before comparing systems. A system can change strongly yet recover rapidly, while another changes little but recovers slowly. Returning one output to baseline does not guarantee identical species composition or restored every function. Compare reference variability and the time interval rather than rank ecosystems by one undefined resilience label.
A changes from 100 to 20, then returns to 100 by year four; B changes less but has not returned in that interval.
Response criteria
- Read the structures, axes, directions and units correctly.
- Connect the evidence with the biological mechanism.
- Respect stated model assumptions and distinguish an observation from a further inference.
Problem 50
Answer and explanation
It has low resistance for this disturbance/output but relatively rapid recovery over the stated interval. Output recovery alone does not establish restored species composition or every ecological function.
It has low resistance for this disturbance/output but relatively rapid recovery over the stated interval. Output recovery alone does not establish restored species composition or every ecological function.
Response criteria
- Use the stated measurements or conditions, with correct units.
- Connect the result to the biological mechanism or evidence relationship.
- Identify the assumption, model limit or further evidence requested.
Problem 51
Answer and explanation
3 species
Only three have nonzero observed counts.
Problem 52
- Comparable untreated sites and consistent sampling
- Changing methods every visit
- Only an expected result
- Removing all uncertainty statements
Answer and explanation
Comparable untreated sites and consistent sampling
Comparison sites help account for other changes.
Problem 53
Answer and explanation
It may fail important outcomes or impose other costs; compare criteria and constraints.
Problem 54
Answer and explanation
No confident ranking follows from these counts alone.
Sampling effort differs and rare species need time to detect.
Use comparable effort or a method that accounts for detection before ranking.
Response criteria
- Use the stated conditions.
- Show the evidence or calculation.
- Explain the conclusion and any stated limitation.
Problem 55
Hints
Observed count is not automatically total species present.
Answer and explanation
It improves comparability and helps distinguish real change from detection or timing effects.
Problem 56
Hints
State what the supplied observations or conditions establish, and separate that from any assumption.
Answer and explanation
Whether isolation is actually a limiting mechanism; the design must address the documented cause and measure relevant outcomes.
Problem 57
Answer and explanation
This limits selecting only favorable measures afterward and makes the evaluation transparent and testable.
A monitoring criterion states what result would support progress, reveal failure or trigger revision. Reference sites help distinguish intervention effects from broader changes, though they need comparable conditions and sampling. A before–after difference can be misleading when weather, detection or other pressures also change. Record methods, repeated observations and uncertainty before selecting favorable outcomes. A project’s activity count, such as materials installed, is not automatically evidence that the desired ecological mechanism occurred.
This limits selecting only favorable measures afterward and makes the evaluation transparent and testable.
Response criteria
- Read the structures, axes, directions and units correctly.
- Connect the evidence with the biological mechanism.
- Respect stated model assumptions and distinguish an observation from a further inference.
Problem 58
Answer and explanation
Their areas are 10,000 m² and perimeters 400 versus 500 m. Boundary exposure and width differ, but species, habitat quality, connectivity, disturbance, costs and goals determine the useful comparison.
Their areas are 10,000 m² and perimeters 400 versus 500 m. Boundary exposure and width differ, but species, habitat quality, connectivity, disturbance, costs and goals determine the useful comparison.
Response criteria
- Use the stated measurements or conditions, with correct units.
- Connect the result to the biological mechanism or evidence relationship.
- Identify the assumption, model limit or further evidence requested.