Ecosystems & Conservation Decisions — Print · Life Science: Biology, Grade 10
Analyze populations, food webs, cycles, disturbance, and evidence for conservation designs.
Printable chapter lessons and review.
Populations & Communities
Learning goals
- I can distinguish exponential from logistic population growth and explain what causes the difference.
- I can explain how limiting factors set an ecosystem's carrying capacity, and identify the main ways species interact.
Readings for this unit
Before this unit
Distinguish population, community and ecosystem.
Use three flexible study sessions: core explanation and Parts 1–2; Parts 3–4 with their reasoning checks and models; then the whole-unit application, worked examples, independent practice, and exit check. Allow about 50–60 minutes per session, including diagrams, data work, and notebook explanations. Attempt each check before opening its guidance. Schedule chapter investigations, review, and exams separately; add time where prerequisites are uncertain. Trace the explained visual parts and write a first model, then attempt the illustrated and changed independent cases. In the third session explain a correction and revise the opening account using evidence.
Start with something to explain
Why can a population rise without a higher birth rate?
Illustrative evidence case. Births, deaths and crossing the boundary contribute separately; resource and interaction conditions can change growth.
Notice and wonder
Record two observations using the stated quantities or relationships. Keep observations separate from possible causes. Write one question that a new measurement could help answer.
Why can a population rise without a higher birth rate?
Your first model
Draw the population boundary and all four count-changing flows.
Build the language from the idea
- population
- All the members of a single species living and interbreeding in the same area at the same time.
- exponential growth
- Growth in which a population increases by a constant proportion each period, producing a rapidly steepening J-shaped curve.
- logistic growth
- Growth that starts fast but slows and levels off as a population nears the limits of its environment, producing an S-shaped curve.
- carrying capacity
- The maximum population size (symbol K) that an environment can support over the long term, given its resources.
- limiting factor
- Any resource or condition — food, water, space, predators, disease, weather — that restricts how large a population can grow.
- symbiosis
- A close, long-term relationship between two different species, which may benefit both (mutualism), benefit one without affecting the other (commensalism), or benefit one at the other's expense (parasitism).
Ecology is the study of how living things interact with one another and with their surroundings, and it is built out of a few nested levels. A population is all the members of one species living together in the same place — every gray wolf in a valley, every cattail in a marsh. Zoom out and you find a *community*: all the different populations sharing that area, from the wolves and deer down to the grasses and soil bacteria. Zoom out once more and you add the nonliving surroundings — sunlight, water, soil, climate — to get an ecosystem. This first knowledge point lives at the population and community levels, asking a deceptively simple question: what decides how many individuals an area can hold?
Start with a population that has everything it needs and nothing holding it back. Under those ideal conditions a population shows exponential growth: it increases by the same *proportion* each period, so the more individuals there are, the faster new ones are added. Picture bacteria that double every hour — 1 becomes 2, 2 becomes 4, then 8, 16, 32 — a curve that starts almost flat and then rockets upward into the unmistakable J-shape. The catch is that no population can sustain this forever. Keep doubling and the numbers quickly become impossible; a single dividing bacterium would, in theory, blanket the planet in a matter of days. Something always intervenes.
What intervenes is the real world's finite supply of resources. As a population grows denser, food, water, nesting sites, and space get shared ever more thinly, and predators and diseases find easy targets in the crowd. A useful idealized model predicts an S-shaped pattern called logistic growth. Real populations need not follow that smooth curve: conditions, delays and movement can produce oscillations, overshoot or decline. The population climbs quickly at first, then decelerates, and finally levels off at a ceiling called the carrying capacity, written K. At carrying capacity the birth rate and death rate roughly balance, so the population hovers near K rather than climbing higher. Carrying capacity isn't a fixed magic number, either: a rainy year that grows extra grass can raise it, while a drought or a wildfire can lower it.
The brakes on growth are called limiting factors, and biologists sort them into two revealing kinds. Density-dependent factors bite harder as a population gets more crowded — competition for food, the spread of disease, and heavier predation all intensify when individuals are packed close together, and can slow growth without guaranteeing a return to one stable K. Density-independent factors strike regardless of how crowded things are — a hard freeze, a flood, a volcanic eruption, or a habitat-clearing storm can wipe out the same fraction of a sparse population as a dense one. Both kinds shape carrying capacity, but only density-dependent factors act like a self-correcting thermostat that can moderate growth, with strength and delays varying among systems.
Populations never grow in isolation; they are constantly pushing and pulling on the other species around them. The most familiar interaction is competition, which flares whenever organisms need the same limited resource, whether it's two hawk species hunting the same mice or seedlings racing for the same patch of sunlight. When two species compete for an identical niche, one is usually a little better at it — and over time the *competitive exclusion principle* says the weaker competitor is squeezed out of that niche entirely. A second interaction is predation, in which one organism eats another; predator and prey numbers can fluctuate with a time lag, and predator effects depend on food-web relationships and other conditions; neither cycles nor a stable community balance are guaranteed.
Not every relationship is a contest. In symbiosis, two species live in close, long-term partnership, and biologists classify these by who comes out ahead. In *mutualism* both partners benefit — think of a bee sipping nectar while ferrying a flower's pollen, or the gut bacteria that help you digest food in exchange for a warm home. In *commensalism* one species gains while the other is essentially unaffected, like barnacles hitching a ride on a whale. In *parasitism* one species profits at the other's expense, as a tapeworm or tick drains its host. Add these partnerships to competition and predation and you get a community woven together by countless threads — which is exactly why removing or adding even one species can send effects rippling far beyond it.
A population includes one species in a defined area; a community includes interacting populations. An ecosystem also includes nonliving conditions and transfers. Define the spatial boundary before comparing abundance or interactions.
Births, deaths, immigration and emigration change population size. Limiting factors can depend on density or occur independently of it. A carrying capacity is a model value that can change with resources and environmental conditions, not a permanent species-wide constant.
Competition, predation and mutualism affect organisms in context. A pairwise interaction can have indirect effects through the rest of a food web. Use repeated population evidence rather than assuming every rise or fall has one simple cause.
Build your understanding
Use three flexible study sessions: core explanation and Parts 1–2; Parts 3–4 with their reasoning checks and models; then the whole-unit application, worked examples, independent practice, and exit check. Allow about 50–60 minutes per session, including diagrams, data work, and notebook explanations. Attempt each check before opening its guidance. Schedule chapter investigations, review, and exams separately; add time where prerequisites are uncertain.
Part 1 · Populations, densities, and rates
A population contains one species within a defined boundary; a community includes interacting populations. Density is number per area or volume. Births, deaths, immigration and emigration change a count, and the boundary determines what movement is included. A percentage growth rate compares change with starting size, while an absolute change counts individuals. The plotted 10%-per-year model has increasing absolute additions; it is not a promise that real populations grow without constraints.
Read the visual model
Identify the labeled structures and units, then trace the arrows or compare values under the caption’s stated conditions. Separate the displayed evidence from a further inference. Write your reasoning before opening the guidance.
If births add 15, deaths remove 8, immigration adds 6 and emigration removes 3, what is the net change?
Visual reasoning — after your attempt
+15−8+6−3 = +10 individuals within the stated boundary.
A population is the individuals of one species in a defined area, and most ecological questions about it are quantitative: how many, how densely, and changing how fast. Density is individuals per unit area or volume, and a growth rate is a change expressed as a proportion of the starting number, which is why a rise from 120 to 150 is reported as 25 percent rather than as 30 animals.
Rates matter more than totals because they reveal direction. Two populations of 500 behave very differently if one is growing at 20 percent a year and the other shrinking at 5 percent. Estimating these numbers requires sampling — quadrats for plants, mark-recapture for mobile animals — and every estimate carries the uncertainty of its method.
Pause and explain
Why is a percentage growth rate more informative than the number of individuals added?
Check your reasoning after answering
A percentage expresses the change relative to the population's size, so it is comparable between populations of different sizes and it projects forward. Ten animals added to a population of 20 is a very different situation from ten added to 2,000.
Part 2 · Two growth patterns
Exponential growth has a constant proportional growth rate under the model; logistic growth includes a decline in proportional growth as population approaches a modeled carrying capacity. Carrying capacity depends on resources, conditions and interactions rather than a permanent property carved into a habitat. Real populations can overshoot, fluctuate, migrate or change their environment. A supplied smooth curve is a comparison of assumptions; it does not guarantee a particular stable number or prove which mechanism governs an observed record.
Read the visual model
Identify the labeled structures and units, then trace the arrows or compare values under the caption’s stated conditions. Separate the displayed evidence from a further inference. Write your reasoning before opening the guidance.
Can carrying capacity change even when the species identity stays the same?
Visual reasoning — after your attempt
Yes. Resources, habitat conditions and interacting populations can change the supported abundance under the model.
Exponential growth occurs when a population increases by a constant proportion each interval, producing an ever-steepening curve. It happens when resources are effectively unlimited — early colonization, or a population released from a constraint — and cannot continue indefinitely in a finite environment.
Logistic growth begins the same way but slows as the population approaches the carrying capacity, the number the environment's resources can sustain, and then levels off. The slowing is caused by density-dependent factors: as crowding increases, competition for food and space intensifies and disease transmits more readily. Carrying capacity is not a fixed property of a place; it changes as resources change.
Pause and explain
Why does logistic growth slow near carrying capacity while exponential growth does not?
Check your reasoning after answering
Logistic growth includes density-dependent effects: as the population rises, competition, disease, and waste accumulation increase per individual and reduce the growth rate. Exponential growth assumes those effects are absent, which is only possible while resources remain effectively unlimited.
Part 3 · Limiting factors, dependent and independent
A density-dependent effect changes per-individual impact with density, as selected competition or infection processes can. A density-independent event can affect abundance without that same dependence, though its final consequences still interact with conditions. A storm killing organisms does not automatically create feedback that restores a fixed population. Define the per-individual effect and compare densities under matched conditions. Changes in total losses can occur simply because more individuals are exposed even when the per-individual rate is unchanged.
Read the visual model
Identify the labeled structures and units, then trace the arrows or compare values under the caption’s stated conditions. Separate the displayed evidence from a further inference. Write your reasoning before opening the guidance.
Why is a larger total number lost not alone evidence of density dependence?
Visual reasoning — after your attempt
More individuals can experience the same per-individual risk; density dependence concerns how that risk or effect changes with density.
Density-dependent factors act more strongly as a population becomes denser: competition for food, territory and mates, predation that concentrates on abundant prey, and the spread of disease. These produce the feedback that stabilizes a population near carrying capacity, so they are the mechanism behind logistic growth.
Density-independent factors act regardless of population size — a frost, a flood, a fire, a storm. They can reduce a population dramatically but they do not regulate it, because their effect is unrelated to how many individuals are present. Distinguishing the two is what separates a population that is being regulated from one that is being repeatedly knocked down.
Pause and explain
Why can a density-independent factor reduce a population without regulating it?
Check your reasoning after answering
Regulation requires feedback: the factor must act more strongly when the population is large and less strongly when it is small. A frost kills a similar proportion whatever the density, so it changes numbers without pushing them toward any particular level.
Part 4 · Interactions between species
A niche describes an organism’s ecological relationships and resource use, not merely its address. Competition concerns shared limiting resources; predation involves one organism consuming another; mutualism benefits both partners under relevant conditions. Time, space and resource differences can reduce competition even within one habitat. Effects can also spread indirectly through a community. To classify an interaction, define the resource and measured outcome for each partner, and allow that the relationship may change with conditions.
Read the visual model
Identify the labeled structures and units, then trace the arrows or compare values under the caption’s stated conditions. Separate the displayed evidence from a further inference. Write your reasoning before opening the guidance.
Are two species in the same habitat necessarily strong competitors?
Visual reasoning — after your attempt
No. Different resources, timing or other conditions can limit overlap; actual effects need evidence.
Populations interact in ways that can be classified by their measured effects. In competition both species are harmed by the overlap in what they need. In predation one benefits and the other is consumed. Symbiosis covers close long-term associations: mutualism benefits both, commensalism benefits one while the other is largely unaffected, and parasitism benefits one at the other's expense.
A species' niche is the full set of conditions and resources it uses, not merely where it lives. Competition depends on niche overlap rather than on sharing a habitat, which is why two species in the same tree may coexist by feeding at different heights or times. Where overlap is near-total, one species is typically excluded unless the two diverge.
Pause and explain
Two species share a habitat but one feeds at night and the other by day on different prey. Are they strong competitors?
Check your reasoning after answering
No. Their niches overlap little, because the resources and times they use differ, and competition depends on that overlap rather than on sharing a location. They can coexist indefinitely.
Apply the whole unit · Read a population record
Illustrative annual counts of a rabbit population on an island with no predators, estimated by mark-recapture. Year 1: 40. Year 2: 78. Year 3: 152. Year 4: 290. Year 5: 480. Year 6: 610. Year 7: 660. Year 8: 655. Year 9: 648. Vegetation surveys show grass cover falling from 70 percent in year 1 to 22 percent in year 8.
Your task
Identify which growth pattern each part of the record shows, calculate the annual percentage growth between years 1 and 2 and between years 6 and 7, estimate the carrying capacity and justify the estimate, and explain which limiting factor the vegetation data implicate and whether it is density-dependent. Then state one limitation of mark-recapture estimates here.
What your response should show
- Choose the appropriate biological model or relationship and state the conditions it assumes.
- Show the counts, rates, ratios, or intermediate reasoning the question requires.
- Use the supplied evidence to justify the conclusion and separate observation from inference.
- Identify a meaningful limitation, uncertainty, or next measurement.
Response guidance — after your attempt
Years 1 to 5: counts roughly double each year early on — 40, 78, 152, 290 — which is exponential growth.
Growth rate years 1 to 2: (78 − 40) / 40 × 100 = 95 percent.
Growth rate years 6 to 7: (660 − 610) / 610 × 100 ≈ 8.2 percent, so growth has slowed sharply.
Years 7 to 9: 660, 655, 648 — the population has levelled and is drifting slightly down, so the pattern over the whole record is logistic.
Estimate carrying capacity at roughly 650 to 660 under these conditions, since that is where growth stopped; the slight decline suggests the population may have slightly overshot.
Identify the limiting factor: grass cover fell from 70 to 22 percent as the population grew, implicating food supply, and competition for food intensifies with density, so it is density-dependent.
State the limitation: mark-recapture assumes marks are not lost, marked and unmarked animals are equally catchable, and the population is closed during sampling; violations bias the estimate, and no confidence interval is given here.
The early record is exponential — 95 percent growth between years 1 and 2, with numbers roughly doubling annually to year 5 — and the later record levels off, giving a logistic pattern overall. Growth had fallen to about 8.2 percent by years 6 to 7 and to slightly negative by year 9, so carrying capacity under these conditions is about 650 to 660, with the small decline from 660 suggesting a modest overshoot. The vegetation survey implicates food: grass cover fell from 70 to 22 percent as the population rose, and competition for a shrinking food supply intensifies with density, making it a density-dependent factor and the mechanism behind the levelling. The estimates themselves should be treated with caution, since mark-recapture assumes marks persist, that marked and unmarked animals are equally likely to be caught, and that no animals enter or leave during sampling; no uncertainty range is reported, so the carrying-capacity figure is an approximation rather than a measurement.
Scientific references and adapted source figures
- OpenSciEd 7.5 — ecosystem dynamics and public case graphs
- OpenSciEd middle-school source license — CC BY 4.0
- OpenStax — population models and their environmental limits
Parent / teacher teaching notes
Insist on rates rather than differences — the percentage calculation is what makes the two growth patterns distinguishable in a table of numbers. The density-dependent against density-independent distinction is the one students most often blur, and the test question to ask is whether the factor would act differently if the population were half as large. The vegetation data are included deliberately: a population record alone cannot identify a limiting factor, and pairing it with a resource measurement is what makes the explanation evidence-based. Ask for an explanation of each label, arrow and axis before calculation. Keep first and revised models; attempt the changed case before consulting guidance. Distinguish invented instructional records from named historical sources. Source chromosome symbols are allele-category models, not DNA sequences. These independently authored high-school supplements are not the full OpenSciEd teacher editions or an endorsement.
The key idea
Births, deaths and movement change population size. Exponential and logistic curves are conditional models; real populations can fluctuate, decline or overshoot. Resources, density, disturbance and species interactions influence outcomes without guaranteeing a stable balance.
Exponential Growth (doubling)
N = N₀ × 2ⁿ
N₀ is the starting population size and n is the number of doubling periods; unlimited resources give this J-shaped curve.
Logistic Growth
growth rate = r × N × (K − N) / K
N is the current population, K is the carrying capacity, and r is the maximum growth rate; the (K − N)/K term slows growth to zero as N approaches K, producing an S-shaped curve.
Worked examples
Example 1
- Exponential doubling follows N = N₀ × 2ⁿ, where N₀ is the starting number and n is the number of doublings.
- Here N₀ = 40 and n = 3 years, so N = 40 × 2³.
- 2³ = 8, so N = 40 × 8 = 320.
Example 2 · Worked application
- Net change=60−45+20−10=25.
- Add to starting size: 500+25=525.
Include both migration flows, not just births and deaths.
Example 3
- As the population climbs toward the island's resources, each rabbit gets a smaller share of food and space, so the birth rate falls and the death rate rises.
- Exponential (J-shaped) growth slows and bends into an S-shaped logistic curve that flattens out near 500, the carrying capacity, where births roughly equal deaths.
- Density-dependent limiting factors drive this: for example, competition for a shrinking food supply and lack of space or shelter (disease spreading through the crowd would work too).
Example 4
- Net change=30+10−20−5=15.
- New size=200+15=215.
Example 5 · Find and fix the mistake
- Test the claim against the stated conditions: Include both migration flows, not just births and deaths.
- Resources, habitat and interactions change, so capacity is context-dependent.
Include both migration flows, not just births and deaths.
Example 6 · Reason from the visual evidence
- A density-dependent effect changes per-individual impact with density, as selected competition or infection processes can. A density-independent event can affect abundance without that same dependence, though its final consequences still interact with conditions. A storm killing organisms does not automatically create feedback that restores a fixed population. Define the per-individual effect and compare densities under matched conditions. Changes in total losses can occur simply because more individuals are exposed even when the per-individual rate is unchanged.
- More individuals can experience the same per-individual risk; density dependence concerns how that risk or effect changes with density.
Original selected loss-rate/density models, not universal storm or infection behavior.
Avoid these mistakes
- Carrying capacity can change and is not one fixed number for a species everywhere.
Check your understanding
A population starts at 200, gains 30 births and 10 immigrants, and loses 20 deaths and 5 emigrants. Find the new size.
Discuss the answer
215 individuals under the stated accounting.
Why should a population calculation include migration as well as births and deaths?
Discuss the answer
Immigration and emigration change the count within the boundary just as births and deaths do. Omitting them can misattribute a population change to reproduction.
Return to the phenomenon
Return to the initial case. Why can a population rise without a higher birth rate? Revise your drawing or explanation using two named ideas and one stated limitation.
Compare explanations after your attempt
A complete budget includes migration; density, percentage growth and limiting mechanisms are distinct quantities.
What should we investigate next?
Which comparison would test a remaining uncertainty? State what you would change, keep comparable and measure.
Investigate, explain and revise
Complete these tasks after the teaching parts. Preserve your first model and a supported revision; use guidance after a real attempt.
Activity 1 · Return to the opening case
Use the opening question, defined terms, Parts 1–4 and your notebook. The supplied-data route needs no equipment or external account.
Your task
Return to the initial case. Why can a population rise without a higher birth rate? Revise your drawing or explanation using two named ideas and one stated limitation.
Success criteria
- Use relevant stated observations.
- Explain the mechanism with a labeled model.
- Distinguish quantities and assumptions.
- Describe a revision and a useful next test.
Hint
Follow objects, materials and information separately. Check what each measured quantity means.
Response guidance — discuss after your attempt
A complete budget includes migration; density, percentage growth and limiting mechanisms are distinct quantities.
Activity 2 · Transfer to a changed case
Cover the worked guidance and use the unit explanations/figures to solve a changed problem.
Your task
A population starts at 80, with 20 births, 12 deaths, 9 immigrants and 5 emigrants. Find final count, change and percentage change.
Success criteria
- Use the stated measurements or conditions, with correct units.
- Connect the result to the biological mechanism or evidence relationship.
- Identify the assumption, model limit or further evidence requested.
Hint
Name the stated conditions, select the relevant mechanism and show intermediate reasoning.
Response guidance — discuss after your attempt
Final count is 80+20−12+9−5 = 92. Change is +12, or 12/80×100 = 15%, under the stated boundary and interval.
Words to know
- population
- All the members of a single species living and interbreeding in the same area at the same time.
- exponential growth
- Growth in which a population increases by a constant proportion each period, producing a rapidly steepening J-shaped curve.
- logistic growth
- Growth that starts fast but slows and levels off as a population nears the limits of its environment, producing an S-shaped curve.
- carrying capacity
- The maximum population size (symbol K) that an environment can support over the long term, given its resources.
- limiting factor
- Any resource or condition — food, water, space, predators, disease, weather — that restricts how large a population can grow.
- symbiosis
- A close, long-term relationship between two different species, which may benefit both (mutualism), benefit one without affecting the other (commensalism), or benefit one at the other's expense (parasitism).
The fur-trade ledgers that revealed predator-prey cycles
For nearly a century, the Hudson's Bay Company recorded how many snowshoe hare and Canada lynx pelts trappers brought in each year. When ecologists later plotted those numbers, a striking pattern emerged: hare and lynx populations rose and fell together in linked cycles roughly ten years long, with the lynx peak always trailing just behind the hare peak. More hares meant more food for lynx, so lynx numbers climbed; the growing lynx population then knocked the hares back down, and the lynx soon followed. It remains one of the best real-world datasets of predator-prey dynamics — captured, by accident, in accounting books.
A common trap: 'symbiosis' does not mean 'helping'
It's easy to assume symbiosis is always a friendly partnership, but the word simply means two species living in close, long-term contact — and that contact can be harmful. Mutualism (+/+) benefits both, commensalism (+/0) helps one without affecting the other, but parasitism (+/−) benefits one species at the direct expense of the other. A tapeworm and its host are just as much a symbiotic relationship as a bee and a flower. When you classify a symbiosis, always ask the same question: who benefits, and who pays?
The logistic equation, in one line
The S-curve has a tidy piece of math behind it: growth rate = r · N · (K − N) / K, where N is the current population, K is the carrying capacity, and r is the maximum growth rate. The magic is in the (K − N)/K term, a built-in brake. When N is small, that fraction is close to 1, so the population grows almost exponentially. As N climbs toward K, the fraction shrinks toward 0, throttling growth down until it stops right at carrying capacity. One expression captures both the explosive start and the gentle leveling-off.
Two life strategies: live fast or invest slow
Species tend toward one of two reproductive strategies named after that equation. r-strategists bet on quantity: they reproduce fast, produce huge numbers of offspring, and give little or no parental care — think insects, weeds, and bacteria, whose populations boom and bust. K-strategists bet on quality: they have few offspring, invest heavily in caring for each one, and their populations stay near carrying capacity — think elephants, whales, and humans. Neither strategy is 'better'; each is a different solution to the problem of surviving in a world of limited resources.
The sea star experiment that named 'keystone species'
In the 1960s, ecologist Robert Paine ran a now-famous experiment on a rocky Pacific shoreline: he repeatedly removed every predatory Pisaster sea star from a stretch of coast and watched what happened. Freed from their main predator, mussels exploded and crowded out nearly everything else, and the number of species in the area collapsed from fifteen to eight. A single predator, it turned out, had been holding the whole community's diversity together. Paine coined the term keystone species for organisms whose impact on an ecosystem is far larger than their numbers would suggest.
In the real world
Wildlife and fisheries managers estimate a species' carrying capacity to set sustainable harvest limits — catch or hunt too far below K and the population wastes resources it could use to rebound; push it far past what the habitat can support and the population can crash.
Exit check
Why can carrying capacity change?
Check your explanation after answering
Resources, conditions, species interactions, and human changes can alter what a system supports; capacity is not a permanently fixed property.
Explain your reasoning without notes. If a key idea is missing, revisit the lesson and try again.
Energy Flow in Ecosystems
Learning goals
- I can classify organisms as autotrophs or heterotrophs and place them on trophic levels in a food web.
- I can use the 10% rule to calculate the energy available at each level of an energy pyramid.
Readings for this unit
Before this unit
Distinguish matter recycling from energy transfer.
Use three flexible study sessions: core explanation and Parts 1–2; Parts 3–4 with their reasoning checks and models; then the whole-unit application, worked examples, independent practice, and exit check. Allow about 50–60 minutes per session, including diagrams, data work, and notebook explanations. Attempt each check before opening its guidance. Schedule chapter investigations, review, and exams separately; add time where prerequisites are uncertain. Trace the explained visual parts and write a first model, then attempt the illustrated and changed independent cases. In the third session explain a correction and revise the opening account using evidence.
Start with something to explain
Why can fewer producers by count or standing mass still support many consumers?
Illustrative evidence case. Stocks, production rates, transfer efficiencies and food-web positions describe different quantities.
Notice and wonder
Record two observations using the stated quantities or relationships. Keep observations separate from possible causes. Write one question that a new measurement could help answer.
Why can fewer producers by count or standing mass still support many consumers?
Your first model
Label time interval and arrow convention before comparing a pyramid or network.
Build the language from the idea
- autotroph
- A 'self-feeder' — an organism such as a plant, alga, or certain bacterium that makes its own food, usually by photosynthesis. Also called a producer.
- heterotroph
- An 'other-feeder' — an organism that gets energy by consuming other organisms. Also called a consumer; includes herbivores, carnivores, and decomposers.
- trophic level
- A feeding step in an ecosystem — producers, then primary consumers, then secondary consumers, and so on.
- biomass
- The total mass of living matter at a trophic level or in an area; a rough stand-in for how much stored energy is present.
- energy pyramid
- A diagram showing how much usable energy is available at each trophic level, with producers forming the wide base.
- ten percent rule
- The generalization that only about 10% of the energy stored at one trophic level is passed on to the next; roughly 90% is used or lost as heat.
- standing biomass
- The biological material present at one instant, distinct from production per time.
- transfer efficiency
- A matched output/input ratio for a specified trophic transfer, time interval and boundary.
Almost every ecosystem on Earth runs on a single power source: the Sun. Capturing that energy is the job of autotrophs — plants, algae, and photosynthetic bacteria that use light to build sugars out of carbon dioxide and water. Because they manufacture their own food from scratch, autotrophs are also called *producers*, and they form the foundation that everything else is built on. (A few unusual autotrophs, such as the bacteria clustered around deep-sea hydrothermal vents, skip sunlight entirely and instead run on chemical energy through *chemosynthesis* — proof that the base of a food web just has to capture energy somehow, not necessarily from light.)
Every other organism is a heterotroph, or consumer, that must eat to obtain energy. Heterotrophs come in tiers: *primary consumers* (herbivores) eat producers directly, *secondary consumers* eat the herbivores, and *tertiary consumers* eat those. A third crucial group, the decomposers and detritivores — such as fungi and bacteria, plus detritivores such as earthworms and scavengers such as vultures — feed on dead bodies and waste, breaking them down and returning nutrients to the soil so producers can use them again. A single line showing who eats whom is a *food chain*, but real ecosystems are tangled: most species eat several foods and are eaten by several predators, so ecologists connect the chains into a food web that reveals just how interdependent a community really is.
Each feeding step in that web is a trophic level. Tracking energy as it climbs from one trophic level to the next uncovers the single most important rule in this whole unit — and it starts with a question: when a rabbit eats grass, where does all the grass's energy go? Most of it never becomes rabbit at all. The rabbit spends the bulk of its food energy simply staying alive — moving, growing, and generating body heat — and much of it ultimately escapes into the surroundings as heat that can never be eaten. Some plant material passes through undigested. Only the small fraction locked into new rabbit tissue is available to whatever eats the rabbit next.
A trophic transfer efficiency compares matched energy inputs and outputs over a stated interval. A ten-percent example is useful for calculation, but actual efficiencies vary among organisms and conditions. For the supplied 10% chain, 10,000 kilocalories at the producer level gives 1,000, 100 and 10 at the next three levels. The rest is not destroyed or all instantly converted to heat: unassimilated material, respiration and other pathways also transfer energy. Thermodynamic constraints do not require a universal exact 90% loss at every step.
A conventional energy pyramid compares energy transfer over the same area and time, and helps explain limits on supported trophic pathways. Standing biomass and organism count are different quantities: aquatic producers can turn over rapidly enough that a small instantaneous stock supports a larger consumer stock, and one tree can support many insects. Food-web boundaries, omnivory and unequal production complicate simple levels. Do not turn the energy constraint into a guarantee that producers are always most numerous or have the greatest standing mass.
Food-system comparisons should state the service, material/energy inputs and conditions rather than infer an exact land-use outcome from a universal 10% rule. Biomagnification concerns increasing concentration of certain persistent substances across a specified trophic pathway; it is different from energy transfer and not automatic for every chemical. This gives a second reason to trace the actual material, uptake and elimination mechanisms instead of applying the energy fraction as a toxin-concentration formula.
Food-web arrows normally show transfer from resource to consumer, not simply which animal points toward its prey. Producers incorporate energy into organic matter, and decomposers use dead material and wastes from multiple levels. Read the arrow convention in each diagram.
Only part of consumed energy becomes new biomass available to the next level. Respiration, unassimilated material and other transfers reduce that amount. A ten-percent rule is an illustrative approximation rather than a constant for every species and condition.
Energy pyramids help explain why long chains have limited support, but omnivory and complex webs blur fixed levels. Track a stated energy amount using a supplied efficiency and acknowledge the boundaries. Useful energy eventually transfers to surroundings as thermal energy.
Build your understanding
Use three flexible study sessions: core explanation and Parts 1–2; Parts 3–4 with their reasoning checks and models; then the whole-unit application, worked examples, independent practice, and exit check. Allow about 50–60 minutes per session, including diagrams, data work, and notebook explanations. Attempt each check before opening its guidance. Schedule chapter investigations, review, and exams separately; add time where prerequisites are uncertain.
Part 1 · Trophic levels as a position, not a species
A trophic level is a position in a specified transfer path, not always one permanent rank for a species. Omnivory connects several food sources; a food web combines many paths. Arrows here point from resource to consumer. Decomposers act on dead material and wastes from several levels, rather than only the final predator. Their chemical breakdown differs from a scavenger consuming a carcass, though both connect detrital pathways. Identify what the arrow transfers before predicting an effect.
Read the visual model
Identify the labeled structures and units, then trace the arrows or compare values under the caption’s stated conditions. Separate the displayed evidence from a further inference. Write your reasoning before opening the guidance.
Why should decomposers connect with more than the top predator?
Visual reasoning — after your attempt
Dead material and wastes originate throughout the web; their resources are not confined to one final level.
A trophic level describes a position in the flow of energy: producers capture it, primary consumers eat producers, secondary consumers eat primary consumers, and so on. Decomposers act on dead material from every level. The level is a role rather than a fixed label, and many species occupy more than one — an omnivore eating both plants and animals feeds at two levels at once.
That is why food webs are more realistic than food chains. A chain shows one pathway; a web shows the many pathways that actually exist, including species that feed at several levels and predators with several prey. Drawing a chain is useful for tracing energy, but treating it as a complete description overstates how simple real ecosystems are.
Pause and explain
Why can one species occupy more than one trophic level?
Check your reasoning after answering
A trophic level describes what an organism is eating, not what species it is. An omnivore that eats both plants and herbivores feeds as a primary consumer and a secondary consumer at the same time.
Part 2 · The ten percent approximation and what follows from it
A trophic transfer efficiency compares a specified output available at a later level with the relevant input in the same interval and boundary. A 10% transfer is a useful supplied approximation, not a biological constant forced by thermodynamics for every species. Unassimilated material, respiration and other transfers contribute differently. Energy not in new biomass is not destroyed and not all of it instantly becomes heat. Applying a fraction repeatedly requires a clearly stated chain and matched quantity rather than mixing energy, organism count and standing mass.
Read the visual model
Identify the labeled structures and units, then trace the arrows or compare values under the caption’s stated conditions. Separate the displayed evidence from a further inference. Write your reasoning before opening the guidance.
At a fourth level after three 10% transfers from 20,000 kJ, how much is represented?
Visual reasoning — after your attempt
20 kJ in this specified model; the fraction must not be assumed universal.
Roughly a tenth of the energy at one trophic level becomes available at the next. The rest is respired and released as heat, excreted, or simply never eaten. The figure varies considerably between ecosystems and should be treated as an order-of-magnitude approximation, not a constant, but it is accurate enough to explain several otherwise puzzling patterns.
Chain length is the clearest. Starting from 20,000 kJ in producers, a tenth leaves 2,000 at the second level, 200 at the third, and 20 at the fourth — a thousandfold reduction after three transfers. There is simply not enough energy left to support a fifth or sixth level, which is why food chains are short everywhere rather than in particular places.
Pause and explain
Using a tenth at each transfer, how much of 20,000 kJ reaches the fourth trophic level, and what does the result explain?
Check your reasoning after answering
20,000 × 0.1³ = 20 kJ. The thousandfold reduction explains why food chains rarely exceed four or five levels: too little energy remains to support a viable population at another level.
Part 3 · Three pyramids that need not match
Standing biomass is material present at one time; production is new material per time. A producer community can turn over rapidly, sustaining consumers while its instantaneous mass remains relatively small, as some aquatic comparisons show. Pyramids of numbers can also invert when many consumers depend on a few large producers. A conventional energy-transfer pyramid uses matched rates and boundaries, not the same snapshot quantity. Distinguish stocks, rates and organism counts before declaring a diagram impossible or generalizing to every system.
Read the visual model
Identify the labeled structures and units, then trace the arrows or compare values under the caption’s stated conditions. Separate the displayed evidence from a further inference. Write your reasoning before opening the guidance.
Does greater consumer standing mass imply energy was created between trophic levels?
Visual reasoning — after your attempt
No. Standing stock differs from production/transfer rate; rapid producer turnover and the stated time boundary matter.
A pyramid of energy always narrows upward, because transfer losses are unavoidable. A pyramid of biomass usually narrows but can be inverted where producers are small, fast-growing, and rapidly consumed, as in some aquatic systems where a small standing crop of algae supports a larger mass of consumers at any instant. A pyramid of numbers can be any shape, since it counts individuals regardless of size.
The reason these differ is that each measures a different quantity: energy flow over time, mass present at an instant, and individual count. A single large tree supporting thousands of insects gives a pyramid of numbers wider at the second level, while the energy pyramid for the same ecosystem still narrows. Noticing which quantity a diagram shows is the skill.
Pause and explain
Why can a biomass pyramid be inverted at an instant while an energy pyramid cannot be?
Check your reasoning after answering
Biomass measures the mass present at one moment, and fast-growing producers can be consumed almost as quickly as they are produced, leaving a small standing crop supporting a larger consumer mass. Energy measures flow over time, and transfer losses mean the total passing to a higher level is always less.
Part 4 · Webs, redundancy, and disturbance
Redundancy means several components can contribute similar functions under conditions; it is not a guarantee that they are interchangeable in amount or quality. A predator losing one prey may decline, switch diets or move, changing pressure on other prey. Indirect effects can therefore reach organisms not linked to the initial change. Evaluate resource availability, feeding preference, competition and timing. A food-web diagram proposes possible routes; quantitative outcomes require observed rates and other constraints rather than one automatic up/down prediction.
Read the visual model
Identify the labeled structures and units, then trace the arrows or compare values under the caption’s stated conditions. Separate the displayed evidence from a further inference. Write your reasoning before opening the guidance.
Why might switching to another prey cause effects beyond the predator itself?
Visual reasoning — after your attempt
It changes consumption pressure and associated interactions on the remaining prey and their partners.
A food web's structure determines how a loss propagates. In a chain, removing one species cuts the pathway and everything above it loses its supply. In a web where a predator has several prey, the loss of one prey species shifts feeding onto the others rather than eliminating the predator, so the effect is spread rather than concentrated.
That spreading has consequences of its own. Pressure on the remaining prey increases, which can cause their populations to fall and produce further changes in the web. Redundancy makes an ecosystem better able to absorb a loss without collapse, but it does not make losses consequence-free, and tracing the knock-on effects is part of interpreting any removal.
Pause and explain
A predator loses one of its three prey species. Predict the consequences and name the one most often overlooked.
Check your reasoning after answering
The predator's population may decline without collapsing, because it can shift to the other two prey. The overlooked consequence is the increased predation pressure on those remaining prey species, which can reduce their numbers and cause further changes elsewhere in the web.
Apply the whole unit · Audit an ecosystem's energy figures
Illustrative annual energy figures for a lake, in kJ per square metre. Energy fixed by algae: 31,000. Energy in zooplankton tissue produced: 2,790. Energy in small fish tissue produced: 251. Energy in large fish tissue produced: 23. Standing biomass measured on one day: algae 4 g/m², zooplankton 11 g/m².
Your task
Calculate the transfer percentage at each of the three steps, state whether the energy pyramid narrows as expected, explain why the standing biomass figures appear inverted while the energy figures do not, and state how many further trophic levels this system could plausibly support. Then name the assumption that comparing a one-day biomass measurement with annual energy figures requires.
What your response should show
- Choose the appropriate biological model or relationship and state the conditions it assumes.
- Show the counts, rates, ratios, or intermediate reasoning the question requires.
- Use the supplied evidence to justify the conclusion and separate observation from inference.
- Identify a meaningful limitation, uncertainty, or next measurement.
Response guidance — after your attempt
Algae to zooplankton: 2,790 / 31,000 × 100 = 9.0 percent.
Zooplankton to small fish: 251 / 2,790 × 100 = 9.0 percent.
Small fish to large fish: 23 / 251 × 100 ≈ 9.2 percent.
The energy pyramid narrows at every step, as it must, with each level holding roughly a tenth of the one below.
Explain the biomass inversion: zooplankton biomass of 11 g/m² exceeds the algae's 4 g/m² because algae are consumed nearly as fast as they grow, so the standing crop at any instant is small even though the annual energy they fix is large.
Project further levels: a fifth level would receive about 9 percent of 23 kJ, roughly 2 kJ per square metre per year, which is almost certainly too little to sustain a population, so the system supports about four levels.
Name the assumption: comparing instantaneous biomass with annual energy flow assumes the one-day measurement represents the year, which is doubtful if algae bloom seasonally.
Transfers are 9.0, 9.0 and about 9.2 percent, so the energy pyramid narrows at every step and each level retains close to a tenth of the one below. The standing biomass looks inverted — 11 g/m² of zooplankton above 4 g/m² of algae — but this is not a contradiction: biomass is the mass present at one instant, and fast-growing algae that are grazed almost as quickly as they grow maintain a small standing crop while supplying a large annual energy flow. A fifth trophic level would receive roughly 2 kJ per square metre per year, far too little to support a population, so four levels is the realistic limit here. The comparison between the two kinds of figure rests on an assumption worth stating: that a single day's biomass represents the whole year. If algae bloom seasonally, that day may be unrepresentative, and repeated sampling through the year would be needed before the inversion could be treated as a stable feature of the lake.
Scientific references and adapted source figures
Parent / teacher teaching notes
The three pyramids are the part of this unit worth real attention, because the shapes can differ and students assume they cannot. Ask which quantity is being plotted before discussing any pyramid's shape. The chain-length calculation is quick and turns "food chains are short" into something derived rather than asserted, and the ten percent figure should always be described as an approximation — stating that honestly is also what makes the diet comparison in the assessment defensible. Ask for an explanation of each label, arrow and axis before calculation. Keep first and revised models; attempt the changed case before consulting guidance. Distinguish invented instructional records from named historical sources. Source chromosome symbols are allele-category models, not DNA sequences. These independently authored high-school supplements are not the full OpenSciEd teacher editions or an endorsement.
An energy pyramid with producers at the wide base and progressively smaller bands for primary consumers, secondary consumers, and top predators, illustrating roughly a 90% energy loss at each step.
The key idea
Energy enters food webs through producers and transfers through feeding and detrital pathways. Only a portion becomes production available to another level; the fraction depends on the stated organisms, interval and boundary. Energy, standing biomass and organism numbers are different quantities.
The 10% Rule (energy transfer)
Energy at next trophic level ≈ Energy at current level × 10%
only about 10% of the energy stored at one trophic level is passed to the next (e.g., producers to primary consumers); the remaining ~90% fuels life processes or is lost as heat.
Worked examples
Example 1
- Producers store 100,000 kcal.
- Primary consumers get about 10%: 100,000 × 0.10 = 10,000 kcal.
- Secondary consumers get about 10% of that: 10,000 × 0.10 = 1,000 kcal.
- Tertiary consumers get about 10% again: 1,000 × 0.10 = 100 kcal.
Example 2 · Worked application
- Convert 12% to 0.12.
- 6000×0.12=720 kJ.
- Efficiency is supplied for this case, not a universal constant.
Production transferred is only part of the total consumed-energy account.
Example 3
- At every step up a food chain, about 90% of the energy is used for life processes or lost as heat, and only about 10% is passed on.
- After four or five steps, so little of the original energy remains that there is not enough to support the biomass of yet another trophic level.
- Because each level holds only about a tenth of the energy (and biomass) of the level below, the ecosystem can sustain a large base of producers but only a very small number of energy-hungry top predators.
Example 4
- Convert 15% to 0.15.
- 8000×0.15=1200 kJ.
Example 5 · Find and fix the mistake
- Test the claim against the stated conditions: Production transferred is only part of the total consumed-energy account.
- Efficiencies vary with organisms, conditions and the energy measure used.
Production transferred is only part of the total consumed-energy account.
Example 6 · Reason from the visual evidence
- Standing biomass is material present at one time; production is new material per time. A producer community can turn over rapidly, sustaining consumers while its instantaneous mass remains relatively small, as some aquatic comparisons show. Pyramids of numbers can also invert when many consumers depend on a few large producers. A conventional energy-transfer pyramid uses matched rates and boundaries, not the same snapshot quantity. Distinguish stocks, rates and organism counts before declaring a diagram impossible or generalizing to every system.
- No. Standing stock differs from production/transfer rate; rapid producer turnover and the stated time boundary matter.
Original snapshot biomass example, not a measured aquatic ecosystem or a matched energy-flow pyramid.
Avoid these mistakes
- The ten-percent transfer rule is not a universal exact biological constant.
Check your understanding
A level contains 8000 kJ of production; supplied transfer efficiency to the next is 15%. Find the next level's production.
Discuss the answer
1200 kJ under the supplied efficiency; remaining energy is not all converted into one identical output.
Why do decomposers connect to more than the top level of a food web?
Discuss the answer
Dead material and wastes arise from producers and consumers at several levels. Decomposer pathways connect those resources and nutrient return, rather than only the final predator.
Return to the phenomenon
Return to the initial case. Why can fewer producers by count or standing mass still support many consumers? Revise your drawing or explanation using two named ideas and one stated limitation.
Compare explanations after your attempt
Energy and matter transfer need defined accounts; biomass/number snapshots and indirect web effects cannot be inferred from one fixed fraction alone.
What should we investigate next?
Which comparison would test a remaining uncertainty? State what you would change, keep comparable and measure.
Investigate, explain and revise
Complete these tasks after the teaching parts. Preserve your first model and a supported revision; use guidance after a real attempt.
Activity 1 · Return to the opening case
Use the opening question, defined terms, Parts 1–4 and your notebook. The supplied-data route needs no equipment or external account.
Your task
Return to the initial case. Why can fewer producers by count or standing mass still support many consumers? Revise your drawing or explanation using two named ideas and one stated limitation.
Success criteria
- Use relevant stated observations.
- Explain the mechanism with a labeled model.
- Distinguish quantities and assumptions.
- Describe a revision and a useful next test.
Hint
Follow objects, materials and information separately. Check what each measured quantity means.
Response guidance — discuss after your attempt
Energy and matter transfer need defined accounts; biomass/number snapshots and indirect web effects cannot be inferred from one fixed fraction alone.
Activity 2 · Transfer to a changed case
Cover the worked guidance and use the unit explanations/figures to solve a changed problem.
Your task
A supplied chain transfers 15% of 8,000 kJ to its primary consumer level, then 8% of that to a secondary level. Calculate both outputs and explain why 10% should not replace the supplied values.
Success criteria
- Use the stated measurements or conditions, with correct units.
- Connect the result to the biological mechanism or evidence relationship.
- Identify the assumption, model limit or further evidence requested.
Hint
Name the stated conditions, select the relevant mechanism and show intermediate reasoning.
Response guidance — discuss after your attempt
The outputs are 1,200 kJ and 96 kJ. The stated transfer fractions define this comparison; ten percent is an approximation, not a compulsory constant.
Words to know
- autotroph
- A 'self-feeder' — an organism such as a plant, alga, or certain bacterium that makes its own food, usually by photosynthesis. Also called a producer.
- heterotroph
- An 'other-feeder' — an organism that gets energy by consuming other organisms. Also called a consumer; includes herbivores, carnivores, and decomposers.
- trophic level
- A feeding step in an ecosystem — producers, then primary consumers, then secondary consumers, and so on.
- biomass
- The total mass of living matter at a trophic level or in an area; a rough stand-in for how much stored energy is present.
- energy pyramid
- A diagram showing how much usable energy is available at each trophic level, with producers forming the wide base.
- ten percent rule
- The generalization that only about 10% of the energy stored at one trophic level is passed on to the next; roughly 90% is used or lost as heat.
- standing biomass
- The biological material present at one instant, distinct from production per time.
- transfer efficiency
- A matched output/input ratio for a specified trophic transfer, time interval and boundary.
The lake study behind the '10% rule'
In 1942, ecologist Raymond Lindeman published a painstaking study of energy moving through a small Minnesota lake, becoming one of the first scientists to actually measure — rather than just describe — how much energy passes from one trophic level to the next. His work helped launch the field of ecosystem ecology and gave the '10% rule' its empirical footing. Real transfer efficiencies actually range from about 2% to 20% depending on the ecosystem; 10% is a convenient round average, not a law of nature.
A stubborn misconception: energy is not recycled
Because matter cycles so neatly, students often assume energy must cycle too — but it doesn't. Energy makes a strictly one-way trip: it enters as sunlight, gets passed up the trophic levels while about 90% is shed as heat at each step, and finally leaves the ecosystem as heat that can never be reused. That's why the arrows in a food web all point one direction and never loop back, and why ecosystems need a constant fresh supply of solar energy but can get by recycling the same atoms of matter indefinitely.
Gross vs net productivity: the base you can actually eat
Producers don't hand over everything they capture. Gross primary productivity (GPP) is the total energy plants capture through photosynthesis, but plants burn a big share of it on their own respiration just to stay alive. What's left — net primary productivity (NPP) — is the energy actually stored as new plant growth, and that's the real amount available to the herbivores that eat them. When ecologists draw an energy pyramid, its base is NPP, which is why the productivity of an ecosystem, not just its greenery, sets how much animal life it can support.
Toxins that ride the pyramid upward
The same 10% climb that drains energy can concentrate poison. Persistent chemicals like DDT and mercury don't break down and dissolve into fatty tissue, so each predator accumulates the toxins from all the prey it ever eats — a process called biomagnification. Biologist Rachel Carson's 1962 book Silent Spring traced how DDT built up in food chains and thinned the eggshells of ospreys, eagles, and other top predators, nearly wiping them out. Her work helped launch the modern environmental movement and led to DDT's ban.
When a pyramid of biomass flips upside down
An energy pyramid is always widest at the bottom, but a pyramid built from biomass — the total mass of living matter at each level at a single instant — can occasionally invert. In the open ocean, microscopic phytoplankton reproduce and get eaten so quickly that the total weight of phytoplankton present at any given moment can be smaller than the weight of the zooplankton feeding on them. Over time the phytoplankton still produce far more total energy; you're just catching a fast-spinning system in a single snapshot.
In the real world
Because roughly 90% of energy is lost turning plants into meat, producing a calorie of beef takes far more land, water, and feed than a calorie of grain — one reason plant-rich diets have a smaller environmental footprint.
Exit check
Does a 10% transfer model imply energy is destroyed at each feeding step?
Check your explanation after answering
No. Energy is conserved but dispersed through heat, metabolism, waste, and other pathways. Only part is represented in production at the next level, and 10% is an approximation.
Explain your reasoning without notes. If a key idea is missing, revisit the lesson and try again.
Biogeochemical Cycles
Learning goals
- I can describe how carbon, nitrogen, and water move through their biogeochemical cycles.
- I can explain why matter is recycled through ecosystems while energy flows through only once.
Readings for this unit
Before this unit
Trace atoms and separate reservoirs from transfer rates.
Use three flexible study sessions: core explanation and Parts 1–2; Parts 3–4 with their reasoning checks and models; then the whole-unit application, worked examples, independent practice, and exit check. Allow about 50–60 minutes per session, including diagrams, data work, and notebook explanations. Attempt each check before opening its guidance. Schedule chapter investigations, review, and exams separately; add time where prerequisites are uncertain. Trace the explained visual parts and write a first model, then attempt the illustrated and changed independent cases. In the third session explain a correction and revise the opening account using evidence.
Start with something to explain
Why can a conserved nutrient still become scarce in one location?
Illustrative evidence case. Material moves between reservoirs and forms; a local stock depends on usable forms, input and output.
Notice and wonder
Record two observations using the stated quantities or relationships. Keep observations separate from possible causes. Write one question that a new measurement could help answer.
Why can a conserved nutrient still become scarce in one location?
Your first model
Label reservoir amounts, annual flows, compound forms and a boundary.
Build the language from the idea
- biogeochemical cycle
- The pathway by which an element or molecule moves through living things (bio), the Earth (geo), and chemical reactions — for example, the carbon, nitrogen, and water cycles.
- carbon cycle
- The movement of carbon among the atmosphere, living things, oceans, soil, and rocks, driven largely by photosynthesis and respiration.
- nitrogen fixation
- The conversion of unusable nitrogen gas (N₂) into ammonia or nitrates that plants can absorb, carried out mainly by certain bacteria (and by lightning).
- transpiration
- The release of water vapor from plant leaves into the air, a major part of the water cycle.
- photosynthesis
- The process by which producers use sunlight to convert carbon dioxide and water into sugar and oxygen.
- cellular respiration
- The process organisms use to break down sugar with oxygen to release energy, giving off carbon dioxide and water.
- nitrification
- Microbial oxidation pathways converting ammonia/ammonium through nitrite to nitrate under suitable conditions.
- denitrification
- Microbial pathways converting oxidized nitrogen compounds to gaseous forms under suitable conditions.
Energy and matter behave very differently in an ecosystem, and the contrast is the heart of this unit. Energy streams in from the Sun and, after powering life for a while, leaves for good as heat — a one-way trip. Matter cannot leave. Earth is essentially a sealed container for atoms: no meaningful supply of new carbon, nitrogen, or water arrives from space. So the same atoms that build one generation of living things must be dismantled and reused to build the next, over and over. The looping pathways that carry elements through the air, water, rock, and living tissue are called biogeochemical cycles, and three of them — carbon, nitrogen, and water — keep the biosphere running.
The carbon cycle tracks carbon as it shuttles among four great reservoirs: the atmosphere (as carbon dioxide gas), living things (whose bodies are built on carbon skeletons), the oceans, and the rocks and fossil fuels underground. The living part of the cycle turns on two mirror-image reactions. Photosynthesis pulls carbon dioxide out of the air and locks its carbon into sugars inside producers; that carbon then travels up the food web as organisms eat one another. Cellular respiration runs the reaction backward — organisms break those sugars down for energy and exhale carbon dioxide straight back into the air. Decomposition and combustion release carbon too. Some of this loop is *fast* (days to years, through living things), and some is *slow* (millions of years, as carbon is buried in limestone and fossil fuels), which is why burning coal and oil — releasing ancient carbon in a geologic instant — matters so much.
The nitrogen cycle solves a stubborn problem. Nitrogen makes up about 78% of the air, and every living thing needs it to build amino acids, proteins, and the DNA that carries genetic information — yet almost nothing can use nitrogen gas (N₂) directly, because its two atoms are locked together by an extraordinarily strong triple bond. The gateway is nitrogen fixation: certain bacteria (including *Rhizobium*, which lives in nodules on the roots of beans, clover, and other legumes) and bolts of lightning convert N₂ into ammonia and nitrates that plants can finally absorb. Plants build that nitrogen into tissue, animals get it by eating plants, and decomposers release it back to the soil when organisms die. Other bacteria then perform *denitrification*, returning nitrogen gas to the atmosphere and closing the loop.
The water cycle moves the most familiar molecule of all. The Sun's heat evaporates water from oceans and lakes, and plants add their share through transpiration, releasing water vapor from tiny pores in their leaves — together these lift enormous volumes of water into the sky. The vapor rises, cools, and *condenses* into clouds, then returns to the surface as *precipitation* — rain or snow. From there it runs off into rivers or soaks down into groundwater, and the journey begins again. Along the way, moving water dissolves and carries minerals and nutrients, quietly stitching the water cycle into the carbon and nitrogen cycles.
Notice the common thread running through all three cycles: the same atoms are used again and again, handed off at key junctions by producers, decomposers, and specialized bacteria. A single carbon atom in your breath this morning may once have been part of a dinosaur, a limestone cliff, and an ocean wave. This is the decisive difference between matter and energy in ecology — matter cycles endlessly within the system, while energy flows through once and dissipates. A healthy ecosystem depends on both: a steady one-way supply of energy to do work, and tight recycling of the limited matter available.
Because these cycles are so tightly balanced, human activity can throw them off with surprising force. Burning fossil fuels floods the atmosphere with carbon dioxide faster than photosynthesis and the oceans can pull it back out, tipping the carbon cycle and warming the climate. Manufacturing synthetic fertilizer has more than doubled the amount of usable nitrogen entering ecosystems; when that excess washes off farm fields into rivers and lakes, it triggers *eutrophication* — explosive algae growth that, on dying, is decomposed by bacteria that strip the water of oxygen and suffocate fish. Even the water cycle bends under deforestation and paved cities, which cut transpiration and speed runoff. Understanding these cycles, in other words, is the first step to understanding the human impacts we turn to next.
Carbon, nitrogen and water move through biological and nonliving stores. Matter cycling requires mechanisms such as photosynthesis, decomposition and microbial transformations. A reservoir's size and the rate entering or leaving it are different quantities.
Plants generally acquire nitrogen in usable compounds rather than directly using atmospheric N₂. Microbial processes can fix nitrogen, transform compounds and return nitrogen to the atmosphere. The cycle includes several pathways rather than one compulsory circle.
Human actions can change flows, such as fertilizer input or fossil-carbon release. A nutrient increase can stimulate growth and later oxygen depletion as decomposition proceeds. State the mechanism and limiting conditions, since not every added nutrient produces the same response.
Build your understanding
Use three flexible study sessions: core explanation and Parts 1–2; Parts 3–4 with their reasoning checks and models; then the whole-unit application, worked examples, independent practice, and exit check. Allow about 50–60 minutes per session, including diagrams, data work, and notebook explanations. Attempt each check before opening its guidance. Schedule chapter investigations, review, and exams separately; add time where prerequisites are uncertain.
Part 1 · Reservoirs and fluxes
A reservoir or stock is an amount stored; a flux is a transfer amount per time. Large inputs and outputs can nearly balance, leaving little net change, while small persistent imbalances accumulate. A storage model needs starting amount, boundary and time interval. It does not imply a material appears whenever a reservoir gains it; identify the source reservoir and outgoing processes. Matter cycling and useful energy flow are distinct accounts, so a closed atom budget does not make work indefinitely self-powered.
Read the visual model
Identify the labeled structures and units, then trace the arrows or compare values under the caption’s stated conditions. Separate the displayed evidence from a further inference. Write your reasoning before opening the guidance.
What happens to a 100-unit stock after three years of input 8 and output 5 per year?
Visual reasoning — after your attempt
It reaches 109 units under constant-rate assumptions: 100+3×(8−5).
A biogeochemical cycle is best described with two quantities: reservoirs, which are the amounts held in the atmosphere, oceans, soil, rock, and living things, and fluxes, which are the rates at which the element moves between them. A reservoir grows whenever its inputs exceed its outputs and shrinks when they do not, so the net change is simply the difference between fluxes.
This framing makes the cycles quantitative rather than descriptive. A forest holding 800 tonnes of carbon, gaining 45 and losing 30 in a year, is growing by 15 tonnes. Stating a cycle as a diagram of arrows without rates cannot answer questions about direction or speed, which are usually the questions that matter.
Pause and explain
A reservoir's inputs and outputs are both very large but nearly equal. What does that tell you about its size over time?
Check your reasoning after answering
It stays nearly constant, because the net change is the small difference between the two large fluxes. Large fluxes mean rapid turnover, not a changing reservoir.
Part 2 · Carbon, in and out
The carbon cycle traces carbon atoms among air, organisms, soils, water and geological material. Fixation incorporates inorganic carbon into organic compounds; respiration and decomposition can return it through other transformations. Combustion transfers carbon from fuel to products rather than adding brand-new carbon to Earth. A faster release from a long-stored reservoir can alter the distribution despite conservation across a larger boundary. Rates, storage and process identity must be distinguished when linking organisms with environmental change.
Read the visual model
Identify the labeled structures and units, then trace the arrows or compare values under the caption’s stated conditions. Separate the displayed evidence from a further inference. Write your reasoning before opening the guidance.
Why can fossil-carbon release change atmospheric amount without violating conservation?
Visual reasoning — after your attempt
It transfers existing carbon from another reservoir; conservation concerns the complete boundary, not constant amount in each store.
Carbon enters living things almost entirely through photosynthesis, which fixes atmospheric carbon dioxide into organic molecules. It returns through respiration by all organisms, through decomposition as decomposers respire dead material, and through combustion. These processes are the same chemistry met in the energy chapter, now viewed at the scale of a whole system.
Some carbon leaves circulation for long periods. Organic matter buried in sediment, and carbon incorporated into carbonate rock, can remain out of the cycle for geological spans. Burning fossil carbon returns some of that long-stored material to the atmosphere far faster than burial removes it, which changes the balance between the fluxes rather than creating new carbon.
Pause and explain
Why is burning fossil carbon described as changing a flux rather than adding new carbon?
Check your reasoning after answering
The carbon already existed, stored in a long-term reservoir. Combustion moves it into the atmosphere, increasing that inward flux far faster than burial removes carbon, so the atmospheric reservoir grows while total carbon is unchanged.
Part 3 · Nitrogen: abundant but unusable
Nitrogen fixation converts atmospheric N₂ into forms that can enter biological nitrogen use. Nitrification and denitrification are different microbial transformations; denitrification can return nitrogen to gaseous forms under suitable conditions. Many plants take up nitrogen compounds rather than directly using N₂, with some relying on microbial associations. Availability depends on pathways, soil/water conditions and transport, not only the total nitrogen nearby. A diagram should trace compound forms and mechanisms rather than assign every microbial process the word fixation.
Read the visual model
Identify the labeled structures and units, then trace the arrows or compare values under the caption’s stated conditions. Separate the displayed evidence from a further inference. Write your reasoning before opening the guidance.
Why does 78% nitrogen in air not mean a plant can directly build proteins from that N₂?
Visual reasoning — after your attempt
The appropriate chemical transformation and uptake pathway are needed; atmospheric abundance and usable form differ.
The atmosphere is about 78 percent nitrogen, yet nitrogen frequently limits plant growth. The reason is chemical: atmospheric nitrogen is N₂, held together by a strong triple bond that makes it unreactive, and plants cannot use it in that form. They require nitrate or ammonium, which must be produced by nitrogen-fixing bacteria, by lightning, or industrially.
The cycle then runs through several bacterial steps: fixation produces ammonium, nitrification converts it to nitrate, plants assimilate nitrate into protein and nucleic acids, consumers obtain nitrogen by eating, decomposition returns it to the soil, and denitrification converts soil nitrogen back to atmospheric N₂. Because most steps depend on particular bacteria, the nitrogen cycle is more biologically mediated than the carbon cycle.
Pause and explain
Why does abundance in the atmosphere not make nitrogen available to plants?
Check your reasoning after answering
Availability depends on chemical form, not abundance. Atmospheric N₂ has a strong triple bond and is unreactive, and plants can take up only nitrate or ammonium, so the limiting quantity is the rate at which fixation produces usable forms.
Part 4 · When humans change a flux
An initiating factor starts a chain, while a proximate mechanism directly produces the outcome being explained. A nutrient input can support biological growth; later decomposition and respiration can increase oxygen demand, contributing to low dissolved oxygen under suitable conditions. Nutrient addition is not itself the same event as oxygen being removed by a reaction. Flow, temperature, photosynthesis and other inputs also affect the balance. Test the chain with nutrient, biomass, oxygen and control records rather than infer one universal cause from cloudy water.
Read the visual model
Identify the labeled structures and units, then trace the arrows or compare values under the caption’s stated conditions. Separate the displayed evidence from a further inference. Write your reasoning before opening the guidance.
Why should nutrient amount and dissolved oxygen be measured as different variables?
Visual reasoning — after your attempt
They constrain different steps in the pathway; one input alone does not uniquely establish the final oxygen outcome.
Human activity rarely creates or destroys an element; it changes the rates. Industrial nitrogen fixation and fertilizer use raise the flux of usable nitrogen into soils and waters enormously; fossil-fuel combustion raises the flux of carbon into the atmosphere; land clearance reduces the flux into plant reservoirs. Framing these as flux changes keeps the accounting honest and makes the consequences traceable.
The nitrate case shows how a flux change cascades. Nitrate running into a lake removes the nutrient limit on algae, which bloom and then die in quantity; decomposers respiring that dead material consume dissolved oxygen faster than it is replaced, and fish die of oxygen shortage. The initiating change is in the nitrogen flux, but the proximate cause of the fish deaths is oxygen depletion — a distinction that matters for deciding what to measure and what to do.
Pause and explain
In nutrient runoff that kills fish, why is it important to distinguish the initiating cause from the proximate cause?
Check your reasoning after answering
The initiating cause is the increased nitrate flux, which must be reduced to prevent recurrence, while the proximate cause is oxygen depletion by decomposers, which is what to measure to detect the problem. Confusing them leads to monitoring or intervening at the wrong point.
Apply the whole unit · Balance a carbon budget
Illustrative annual carbon fluxes for one woodland, in tonnes per year over 120 hectares. Into plants by photosynthesis: 610. Out by plant respiration: 300. Out by animal and decomposer respiration: 250. Carbon removed as harvested timber: 35. Carbon added from leaf litter blown in from outside: 12. Measured reservoir in living plants at the start of the year: 4,100 t.
Your task
Calculate the woodland's net annual carbon change and the percentage by which its living-plant reservoir would grow if the net change accumulated there, state whether the woodland is a net sink or source, and identify which single flux change would most quickly turn it into a source. Then explain why the harvested timber figure cannot be treated as a release to the atmosphere.
What your response should show
- Choose the appropriate biological model or relationship and state the conditions it assumes.
- Show the counts, rates, ratios, or intermediate reasoning the question requires.
- Use the supplied evidence to justify the conclusion and separate observation from inference.
- Identify a meaningful limitation, uncertainty, or next measurement.
Response guidance — after your attempt
Total inputs: 610 by photosynthesis plus 12 blown in = 622 t.
Total outputs: 300 plant respiration plus 250 animal and decomposer respiration plus 35 harvested = 585 t.
Net change: 622 − 585 = +37 t per year, so the woodland accumulates carbon.
Percentage growth if accumulated in living plants: 37 / 4,100 × 100 ≈ 0.90 percent.
Classify: inputs exceed outputs, so the woodland is a net carbon sink this year.
Identify the sensitive flux: photosynthesis at 610 t is by far the largest input, so a reduction of about 6 percent — around 37 t, achievable through drought, defoliation, or clearance — would eliminate the surplus and make the woodland a source.
Treat the timber correctly: harvested carbon leaves the woodland but is not necessarily released; it remains stored in wood products until burned or decomposed, so its fate must be tracked separately rather than counted as an atmospheric emission.
Inputs total 622 tonnes and outputs 585, so the woodland gains 37 tonnes of carbon a year and is a net sink. If that surplus accumulated entirely in living plants it would increase that 4,100-tonne reservoir by about 0.90 percent. The budget is sensitive to one flux above all: photosynthesis supplies 610 of the 622 tonnes entering, so a reduction of roughly 6 percent — plausible in a drought year, after defoliation, or following partial clearance — would wipe out the surplus and turn the woodland into a source. The harvested timber needs separate treatment: those 35 tonnes leave the woodland's reservoir but are not released to the atmosphere at that moment, since the carbon stays in wood products until they are burned or decay. Counting it as an emission would overstate the atmospheric effect, and following it requires a second budget for the products themselves.
Scientific references and adapted source figures
Parent / teacher teaching notes
Work these cycles as reservoirs and fluxes with numbers rather than as arrow diagrams to memorize; the net-change arithmetic is what turns the cycle into something that can answer a question. The nitrogen point — abundant yet limiting — is the best single question in the unit, because it requires chemical form rather than quantity. In the eutrophication case, insist on naming both the initiating and the proximate cause, since that distinction is what makes the explanation useful rather than merely correct. Ask for an explanation of each label, arrow and axis before calculation. Keep first and revised models; attempt the changed case before consulting guidance. Distinguish invented instructional records from named historical sources. Source chromosome symbols are allele-category models, not DNA sequences. These independently authored high-school supplements are not the full OpenSciEd teacher editions or an endorsement.
An animated carbon cycle diagram showing carbon dioxide moving between the atmosphere, plants, animals, decomposers, and fossil fuels.
The key idea
Matter moves among organisms and environmental reservoirs through chemical and physical processes. Track each element, pathway and system boundary. Cycling does not make every local reservoir closed or guarantee endless availability; energy transfers eventually disperse as thermal energy.
Worked examples
Example 1
- The plant absorbs the carbon dioxide from the air and, through photosynthesis, locks the carbon atom into a sugar molecule in its leaf.
- A deer eats the leaf, so the carbon atom becomes part of the deer's body tissue.
- The deer breaks the sugar down through cellular respiration and exhales the carbon atom back into the air as carbon dioxide (or decomposers release it after the deer dies).
Example 2 · Worked application
- Nutrient limitation can be reduced, increasing producer growth.
- Decomposition of added organic material consumes oxygen.
- Low oxygen occurs if consumption exceeds replenishment.
Nutrients do not directly become oxygen depletion without a mechanism.
Example 3
- Nitrogen gas (N₂) has a very strong triple bond, so plants cannot break it apart or absorb it directly from the air.
- Nitrogen fixation — carried out mainly by bacteria such as Rhizobium in legume roots, and by lightning — converts N₂ into ammonia and nitrates.
- Plants can absorb those nitrates from the soil, so nitrogen becomes available only after it has been 'fixed' into a usable form.
Example 4
- Added nutrients can stimulate producer growth under limiting conditions.
- Decomposition of added organic matter consumes oxygen faster than it is replenished.
Example 5 · Find and fix the mistake
- Test the claim against the stated conditions: Nutrients do not directly become oxygen depletion without a mechanism.
- Most plants need usable nitrogen compounds; microbes contribute transformations including fixation.
Nutrients do not directly become oxygen depletion without a mechanism.
Example 6 · Reason from the visual evidence
- Nitrogen fixation converts atmospheric N₂ into forms that can enter biological nitrogen use. Nitrification and denitrification are different microbial transformations; denitrification can return nitrogen to gaseous forms under suitable conditions. Many plants take up nitrogen compounds rather than directly using N₂, with some relying on microbial associations. Availability depends on pathways, soil/water conditions and transport, not only the total nitrogen nearby. A diagram should trace compound forms and mechanisms rather than assign every microbial process the word fixation.
- The appropriate chemical transformation and uptake pathway are needed; atmospheric abundance and usable form differ.
Original selected nitrogen-route model, omitting several compounds and microbial pathways; it is not a full balanced nitrogen-cycle chemistry chart.
Avoid these mistakes
- Most plants do not directly turn atmospheric nitrogen gas into usable nitrogen compounds.
Check your understanding
Explain how excess nutrients can lead to low dissolved oxygen in a water body.
Discuss the answer
Nutrient enrichment can promote blooms followed by oxygen depletion, depending on conditions.
Why is a nutrient stock different from its annual input rate?
Discuss the answer
A stock is an amount stored; annual input is amount per time. Net change needs input minus output and the interval, combined with starting stock.
Return to the phenomenon
Return to the initial case. Why can a conserved nutrient still become scarce in one location? Revise your drawing or explanation using two named ideas and one stated limitation.
Compare explanations after your attempt
Conservation does not mean equal distribution or immediate availability; microbial and physical pathways determine transfers and local biological effects.
What should we investigate next?
Which comparison would test a remaining uncertainty? State what you would change, keep comparable and measure.
Investigate, explain and revise
Complete these tasks after the teaching parts. Preserve your first model and a supported revision; use guidance after a real attempt.
Activity 1 · Return to the opening case
Use the opening question, defined terms, Parts 1–4 and your notebook. The supplied-data route needs no equipment or external account.
Your task
Return to the initial case. Why can a conserved nutrient still become scarce in one location? Revise your drawing or explanation using two named ideas and one stated limitation.
Success criteria
- Use relevant stated observations.
- Explain the mechanism with a labeled model.
- Distinguish quantities and assumptions.
- Describe a revision and a useful next test.
Hint
Follow objects, materials and information separately. Check what each measured quantity means.
Response guidance — discuss after your attempt
Conservation does not mean equal distribution or immediate availability; microbial and physical pathways determine transfers and local biological effects.
Activity 2 · Transfer to a changed case
Cover the worked guidance and use the unit explanations/figures to solve a changed problem.
Your task
A nitrogen store begins at 50 units and receives 12 while losing 9 each year for four years. Find its final amount and distinguish that result from the annual input.
Success criteria
- Use the stated measurements or conditions, with correct units.
- Connect the result to the biological mechanism or evidence relationship.
- Identify the assumption, model limit or further evidence requested.
Hint
Name the stated conditions, select the relevant mechanism and show intermediate reasoning.
Response guidance — discuss after your attempt
The final store is 50+4×(12−9)=62 units. Twelve units/year is an input flux, not the stock or net annual gain; the net gain is three units/year.
Words to know
- biogeochemical cycle
- The pathway by which an element or molecule moves through living things (bio), the Earth (geo), and chemical reactions — for example, the carbon, nitrogen, and water cycles.
- carbon cycle
- The movement of carbon among the atmosphere, living things, oceans, soil, and rocks, driven largely by photosynthesis and respiration.
- nitrogen fixation
- The conversion of unusable nitrogen gas (N₂) into ammonia or nitrates that plants can absorb, carried out mainly by certain bacteria (and by lightning).
- transpiration
- The release of water vapor from plant leaves into the air, a major part of the water cycle.
- photosynthesis
- The process by which producers use sunlight to convert carbon dioxide and water into sugar and oxygen.
- cellular respiration
- The process organisms use to break down sugar with oxygen to release energy, giving off carbon dioxide and water.
- nitrification
- Microbial oxidation pathways converting ammonia/ammonium through nitrite to nitrate under suitable conditions.
- denitrification
- Microbial pathways converting oxidized nitrogen compounds to gaseous forms under suitable conditions.
Photosynthesis and respiration: one reaction, run both ways
The carbon cycle's living engine is really a single chemical reaction read in two directions. Photosynthesis combines carbon dioxide and water, using light energy, to build glucose and release oxygen. Cellular respiration does the exact reverse: it combines glucose with oxygen to release energy, giving off carbon dioxide and water. The outputs of one are the inputs of the other, which is why the two are taught side by side — together they shuttle the same carbon and oxygen atoms endlessly between the air and living things.
The chemist who learned to feed billions — and disrupt a cycle
In the early 1900s, chemist Fritz Haber worked out how to pull nitrogen straight from the air and forge it into ammonia; Carl Bosch scaled it into industry, and the Haber-Bosch process was born. It now fixes more nitrogen than all the world's natural processes combined, and roughly half the nitrogen atoms in your body have passed through it. The upside is staggering — synthetic fertilizer feeds billions of people. The downside is that it has more than doubled the reactive nitrogen flooding into ecosystems, driving pollution and dead zones far downstream.
A dead zone the size of a small state
Every summer, fertilizer and animal waste washing down the Mississippi River fuel enormous algae blooms where the river meets the Gulf of Mexico. As the algae die and decompose, bacteria strip the oxygen from the water, creating a 'dead zone' — often thousands of square miles — where fish, shrimp, and crabs cannot survive and must flee or die. It's eutrophication written across an entire coastline, and it's a direct, large-scale consequence of overloading the nitrogen cycle upstream.
The fast cycle and the slow cycle
Carbon actually moves on two very different clocks at once. The fast carbon cycle shuttles carbon among the air, living things, and soil in days to years through photosynthesis and respiration. The slow carbon cycle locks carbon into limestone, seashells, and fossil fuels for hundreds of thousands to millions of years, releasing it only through slow processes like volcanic eruptions. Burning fossil fuels short-circuits this: it takes carbon the slow cycle spent millions of years burying and dumps it back into the fast cycle in a geological instant.
The ocean's hidden bill: acidification
The oceans quietly absorb roughly a quarter of the extra carbon dioxide humans release, which sounds helpful until you follow the chemistry. Dissolved CO₂ reacts with seawater to form carbonic acid, gradually lowering the ocean's pH — a process called ocean acidification. More acidic water makes it harder for corals, clams, oysters, and tiny plankton to build and keep their calcium carbonate shells and skeletons, threatening the base of marine food webs. It's a reminder that a 'carbon sink' isn't free; the carbon cycle sends the bill elsewhere.
In the real world
Farmers have used the nitrogen cycle for centuries without knowing the chemistry: rotating in legume crops like beans and clover, whose root bacteria fix nitrogen, naturally replenishes soil nitrogen and reduces the need for synthetic fertilizer.
Exit check
How can nitrogen fertilizer contribute to oxygen depletion in water?
Check your explanation after answering
Added nutrients can stimulate production; decomposition of increased organic material uses dissolved oxygen through respiration. The sequence depends on local conditions.
Explain your reasoning without notes. If a key idea is missing, revisit the lesson and try again.
Human Impact & Conservation
Learning goals
- I can describe the major ways humans disrupt ecosystems — climate change, pollution, habitat loss, and invasive species — and how they threaten biodiversity.
- I can explain strategies for conservation and sustainability that reduce human impact.
Readings for this unit
Before this unit
Compare evidence, trade-offs and a measurable success criterion.
Use three flexible study sessions: core explanation and Parts 1–2; Parts 3–4 with their reasoning checks and models; then the whole-unit application, worked examples, independent practice, and exit check. Allow about 50–60 minutes per session, including diagrams, data work, and notebook explanations. Attempt each check before opening its guidance. Schedule chapter investigations, review, and exams separately; add time where prerequisites are uncertain. Trace the explained visual parts and write a first model, then attempt the illustrated and changed independent cases. In the third session explain a correction and revise the opening account using evidence.
Start with something to explain
Does more wildlife observed after a project prove that the project restored the population?
Illustrative evidence case. Intervention, survey effort and environmental conditions can change together.
Notice and wonder
Record two observations using the stated quantities or relationships. Keep observations separate from possible causes. Write one question that a new measurement could help answer.
Does more wildlife observed after a project prove that the project restored the population?
Your first model
Connect the specific threat, proposed mechanism, sampling and measured outcomes.
Build the language from the idea
- biodiversity
- The variety of life in an area — the number of different species, the genetic variety within them, and the range of ecosystems they form.
- greenhouse gas
- A gas such as carbon dioxide, methane, or water vapor that absorbs and re-radiates heat, warming the lower atmosphere.
- habitat fragmentation
- The breaking of a large, continuous habitat into smaller, isolated patches, usually by roads, farms, or development.
- invasive species
- A non-native species that spreads rapidly in a new ecosystem because it lacks the predators, diseases, or competitors that limited it back home.
- sustainability
- Using resources in a way that meets present needs without using them up or damaging the environment for future generations.
- conservation
- The careful protection and management of ecosystems, species, and natural resources to prevent their loss.
Human activities can change biodiversity, including genetic variation, species composition and ecosystem relationships. Major pressures include habitat loss/fragmentation, exploitation, pollution, climate-related changes and harmful introduced-species effects. Their importance varies with organism, region and interval. Biodiversity can influence functions and recovery through particular traits and interactions, but more species does not guarantee faster recovery under every disturbance. Use defined baselines and local mechanisms rather than an undated universal extinction multiplier or a blanket resilience claim.
The single biggest driver is habitat loss. As forests are cleared for farmland, wetlands are drained, and land is paved for cities, the places species need to live simply disappear. Even when some habitat survives, habitat fragmentation chops it into isolated islands separated by roads and fields. Fragmentation is more damaging than it looks: small, cut-off populations have less room to roam, less genetic diversity to draw on, and a far higher risk of blinking out one patch at a time. Protecting large, connected areas — and building wildlife corridors between them — is one of the most effective ways to preserve biodiversity.
Layered on top is climate change, driven by the buildup of greenhouse gases. Burning fossil fuels and clearing forests release carbon dioxide (along with methane and nitrous oxide) faster than the carbon cycle can absorb it. These gases let sunlight in but absorb and re-radiate the heat the Earth gives off, trapping extra energy near the surface — the same greenhouse effect that keeps the planet livable, now turned up too high. The consequences cascade: rising temperatures, melting ice and rising seas, more extreme storms and droughts, and oceans turning more acidic as they absorb CO₂. Many species can't shift their ranges or timing fast enough to keep up, so warming reshuffles entire communities.
Pollution is another pressure, and one with a sneaky twist. Beyond the obvious harm of oil spills, smog, and plastic-choked oceans, some pollutants magnify as they climb the food web. Certain toxins — mercury, or pesticides like the now-banned DDT — can persist or be eliminated slowly and accumulate in body tissue. Because each predator eats many contaminated prey, the poison grows more concentrated at every trophic level, a process called *biomagnification*. A chemical that is nearly harmless in the water can reach dangerous levels in top predators such as eagles, tuna, and humans — a direct link back to the energy-pyramid thinking from earlier in this unit.
Another biological pressure involves harmful invasive species. Moved to a new ecosystem by human trade and travel — sometimes on purpose, often by accident — these newcomers frequently arrive without the predators, parasites, and competitors that kept them in check back home. Freed from those limiting factors, their populations can explode along an exponential curve and overwhelm native species. Burmese pythons have devastated mammal populations in the Florida Everglades; zebra mussels have clogged Great Lakes waterways and starved out native shellfish. Overharvesting — overfishing the oceans, overhunting rare animals — adds still more strain, pushing already-stressed populations past their ability to recover.
The picture is serious, but it is not hopeless — because the same species causing the damage can also repair it. Conservation protects and restores ecosystems: national parks and marine reserves shield habitat, captive-breeding and reintroduction programs have pulled species like the California condor back from the brink, and laws such as the Endangered Species Act give threatened wildlife legal protection. Sustainability tackles the root causes by meeting human needs without exhausting the planet: shifting to renewable energy to cut greenhouse gases, farming and fishing at rates ecosystems can replenish, protecting wetlands and forests that store carbon, and the everyday habits of reducing, reusing, and recycling. Recovery varies with species, soil, dispersal, interactions and continuing pressures — which means the choices people make now genuinely determine what the living world looks like for generations to come.
Conservation decisions need a defined goal and baseline, such as habitat connectivity, species abundance or water quality. A protected area alone may not address threats outside its boundary. Compare the proposed mechanism with the measured problem.
Human effects interact: habitat fragmentation can reduce movement, pollution can change survival and introduced species can alter food webs. A simple diagram helps trace possible pathways, while actual impact requires field evidence. Avoid assuming every nonnative species has the same effect.
Monitor results across relevant seasons and compare with untreated sites when feasible. A short-term increase in one indicator may conceal decline elsewhere. A useful recommendation includes benefits, costs, uncertainty and a plan to revise if outcomes differ from predictions.
Build your understanding
Use three flexible study sessions: core explanation and Parts 1–2; Parts 3–4 with their reasoning checks and models; then the whole-unit application, worked examples, independent practice, and exit check. Allow about 50–60 minutes per session, including diagrams, data work, and notebook explanations. Attempt each check before opening its guidance. Schedule chapter investigations, review, and exams separately; add time where prerequisites are uncertain.
Part 1 · Five pressures, distinguished
Habitat loss removes suitable area; fragmentation changes its arrangement and isolation. Exploitation, pollution, climate-related changes and harmful introduced-species effects can act through different mechanisms. Nonnative means introduced outside an earlier range; invasive implies spread with relevant harmful impacts under the definition being used. Not every nonnative organism has the same effect. Compare affected species, resources and measured outcomes rather than attach one threat label to every decline. Broad biodiversity statements do not replace local causal evidence.
Read the visual model
Identify the labeled structures and units, then trace the arrows or compare values under the caption’s stated conditions. Separate the displayed evidence from a further inference. Write your reasoning before opening the guidance.
Would controlling harvest alone necessarily repair a decline caused mainly by lost breeding habitat?
Visual reasoning — after your attempt
No. A measure needs a plausible connection with the diagnosed pressure; multiple interacting threats may require different responses.
Human effects on ecosystems are usually grouped into habitat loss and fragmentation, pollution, invasive species, overharvesting, and climate change. Distinguishing them matters because they call for different responses: a corridor addresses fragmentation but not overharvesting, and a quota addresses overharvesting but not pollution.
They also interact. A fragmented habitat is more easily invaded along its edges; a harvested population reduced in numbers is less able to withstand a bad year; warming shifts the ranges species need while fragmentation blocks the movement that would track it. Treating them as a list of separate problems understates the difficulty, which is why conservation decisions usually involve several pressures at once.
Pause and explain
Why does fragmentation make invasion by introduced species more likely?
Check your reasoning after answering
Fragmentation increases the proportion of edge relative to interior, and edges are more disturbed and more exposed to arriving species. Smaller, more isolated populations of resident species are also less able to resist a new competitor.
Part 2 · Why area and connection matter
A corridor can connect habitat patches for selected organisms; it may also transmit disease, predators or invasive organisms. Edge effects concern changed conditions near a boundary and differ among species and habitat types. One large reserve and several smaller ones have different risks, accessibility and habitat representation; equal area alone cannot decide which design is best. Compare dispersal, habitat quality, disturbance, governance and affected groups. A structural map proposes a route rather than proving that every organism can use it.
Read the visual model
Identify the labeled structures and units, then trace the arrows or compare values under the caption’s stated conditions. Separate the displayed evidence from a further inference. Write your reasoning before opening the guidance.
Why might several separated reserves be useful despite reduced connection?
Visual reasoning — after your attempt
They can represent different habitats or reduce correlated disturbance risk, depending on species and threats; the design needs evidence and goals.
Population size is the link between habitat area and extinction risk. A larger area supports a larger population, which is less vulnerable to chance extinction and retains more genetic variation, since drift has smaller effects when numbers are large. A large patch also has proportionally less edge, preserving interior conditions that many species require.
Connection matters for the same reason. Corridors allow movement between patches, which maintains gene flow and allows a patch where a population has died out to be recolonized. The design question is genuinely contested: several separate patches give protection against a single catastrophe striking everything, so the answer depends on the species involved and the threats expected rather than on a general rule.
Pause and explain
Give one reason several separate reserves might be preferable to one large reserve of the same area.
Check your reasoning after answering
A single catastrophe — fire, disease outbreak, or storm — could affect an entire contiguous reserve at once, while separated patches are unlikely to be hit simultaneously, so some populations survive. The trade-off is smaller populations and less gene flow in each patch.
Part 3 · What evidence a measure needs
Detection probability is the chance of observing a present organism under a sampling method. A count can rise when effort, access, season or tools change even without equal population growth. An intervention evaluation needs baseline and follow-up measurements with suitable comparison sites and comparable methods. Before–after evidence establishes temporal order but does not alone isolate cause. Several indicators can reveal tradeoffs that one abundance measure hides, including condition, reproduction, habitat quality and unintended effects.
Read the visual model
Identify the labeled structures and units, then trace the arrows or compare values under the caption’s stated conditions. Separate the displayed evidence from a further inference. Write your reasoning before opening the guidance.
Why is attributing the whole jump to protection uncertain when survey effort increased?
Visual reasoning — after your attempt
Detection changed with the intervention period and can increase counts; comparable sampling or modeled correction is needed.
A conservation claim has the same requirements as any other experimental claim. It needs a baseline measured before the intervention, a comparison that did not receive the intervention, a stated indicator measured the same way throughout, and a monitoring interval. Without a comparison, a rise after a measure cannot be distinguished from a favourable period, a change in counting effort, immigration, or ordinary fluctuation.
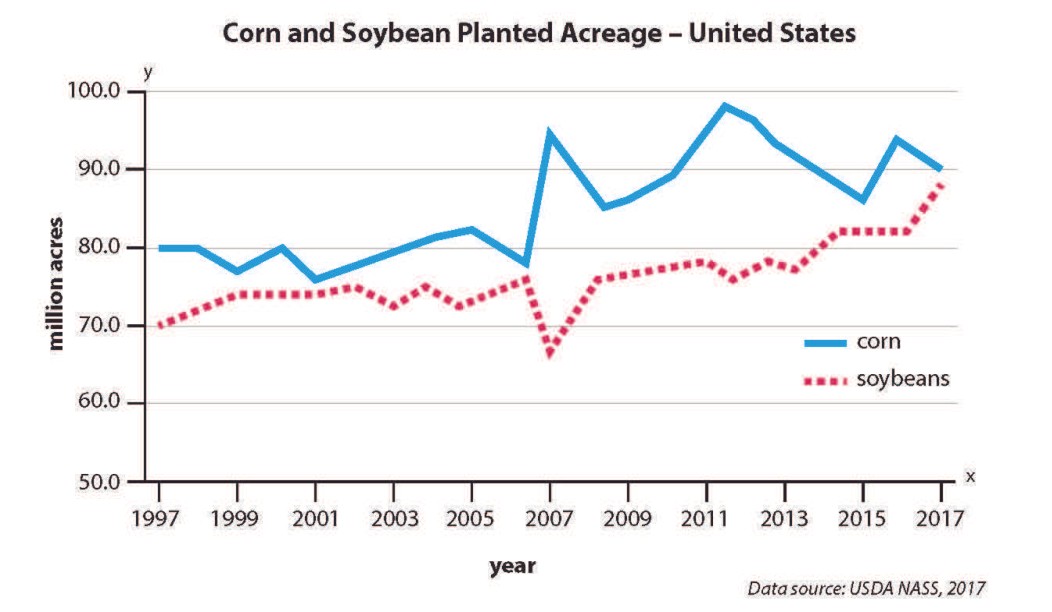
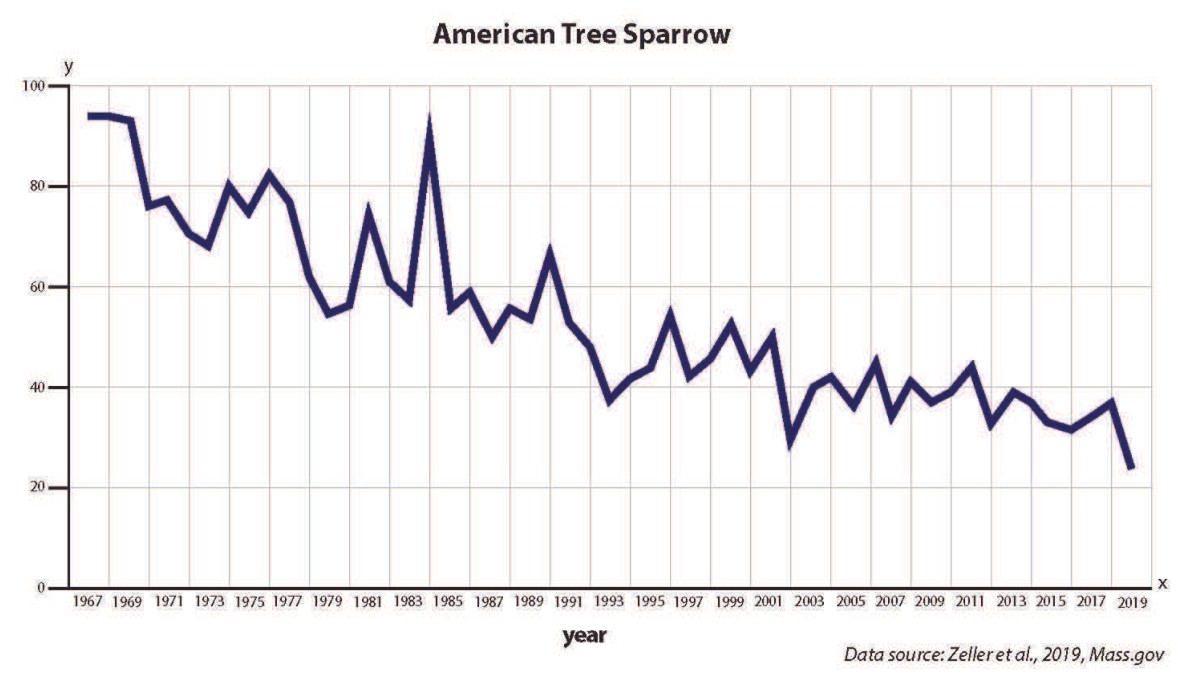
Monitoring design is where conservation claims most often fail, and the failure is usually in good faith: counts are taken more carefully after a measure is introduced because attention has increased, which inflates the apparent effect. Stating the method, the effort, and what result would count as failure is what makes a measure evaluable rather than merely defensible.
Pause and explain
A population is counted more thoroughly after a protection measure begins. What error does that introduce?
Check your reasoning after answering
Increased survey effort detects more individuals, so the count rises even if the population does not. The apparent improvement is an artefact of method, which is why the indicator and the effort must be held constant across the comparison.
Part 4 · Trade-offs, stated honestly
A criterion specifies a desired outcome; a constraint limits feasible choices. Evidence can estimate ecological effects, costs and uncertainties, while people’s values influence priorities, acceptable risks and how impacts are shared. Different groups may reasonably weigh outcomes differently, so state assumptions instead of portraying one score as the only scientifically permitted preference. Compare options with matched definitions and avoid adding unrelated units as if they were one physical total. A transparent proposal includes monitoring and revision when outcomes differ.
Read the visual model
Identify the labeled structures and units, then trace the arrows or compare values under the caption’s stated conditions. Separate the displayed evidence from a further inference. Write your reasoning before opening the guidance.
Can measurements alone decide how every community must weight access versus habitat outcomes?
Visual reasoning — after your attempt
No. Measurements inform consequences, while priorities and acceptable tradeoffs involve values and decision processes.
Conservation decisions allocate limited land, money, and attention, so protecting one thing generally means not protecting another or constraining some human use. A fishing restriction protects a stock and the people who will depend on it later while reducing catches now; the costs and benefits fall on different people and at different times, which is why these decisions are contested rather than merely technical.
Science can establish what is likely to happen under each option and with what uncertainty; it cannot by itself determine which outcome should be preferred. The most useful contribution is therefore a clear statement of the expected effects, their uncertainty, who bears the costs, and what will be measured — leaving the choice visible rather than concealing it inside a recommendation.
Pause and explain
What can evidence settle about a conservation decision, and what can it not?
Check your reasoning after answering
Evidence can estimate what each option is likely to produce and how uncertain that estimate is. It cannot determine how to weigh present costs against future benefits or whose interests should take priority, which are value judgements that belong to the people affected.
Apply the whole unit · Evaluate two conservation claims
Illustrative monitoring records. Claim 1: after a reserve was established, a bird population rose from 240 to 312 over five years, a 30 percent increase; survey effort rose from 20 to 34 observer-days per year over the same period. An unprotected comparison population surveyed at a constant 20 observer-days fell from 250 to 205. Claim 2: a fishery introduced a quota; catch fell from 27,000 to 19,000 tonnes while the estimated stock rose from 90,000 to 104,000 tonnes over four years, with stock estimated by the same survey method throughout.
Your task
Evaluate each claim, calculate the percentage changes involved, identify the specific weakness in Claim 1 and explain whether the comparison population rescues it, and state what makes Claim 2 the stronger of the two. Then name the one additional measurement that would most strengthen Claim 1.
What your response should show
- Choose the appropriate biological model or relationship and state the conditions it assumes.
- Show the counts, rates, ratios, or intermediate reasoning the question requires.
- Use the supplied evidence to justify the conclusion and separate observation from inference.
- Identify a meaningful limitation, uncertainty, or next measurement.
Response guidance — after your attempt
Claim 1 changes: protected population up 30 percent, from 240 to 312; comparison population down (250 − 205) / 250 = 18 percent.
Identify the weakness: survey effort in the protected area rose from 20 to 34 observer-days, a 70 percent increase, so part of the apparent rise could be improved detection rather than more birds.
Assess whether the comparison helps: it rules out a general favourable trend, since the unprotected population fell, but it does not address the effort problem because effort rose only in the protected area.
Claim 2 changes: catch down (27,000 − 19,000) / 27,000 ≈ 30 percent; stock up (104,000 − 90,000) / 90,000 ≈ 16 percent.
Assess Claim 2: the stock estimate used the same method throughout, and the catch reduction and stock increase are consistent with the quota's intended mechanism, so the inference is more secure.
Strengthen Claim 1: re-analyse the counts as birds per observer-day, or repeat the protected-area survey at the original effort of 20 observer-days, which separates detection from population change.
Claim 1 reports a 30 percent rise in the protected population against an 18 percent fall in the unprotected comparison, which does rule out a region-wide favourable period — a real strength. Its weakness is that survey effort in the protected area rose from 20 to 34 observer-days, about 70 percent, so some of the increase may be improved detection rather than more birds; the comparison population cannot correct this because its effort was held constant while the protected area's was not. Claim 2 is stronger: catch fell about 30 percent and the estimated stock rose about 16 percent, with the stock estimated by the same method throughout, so the change cannot be attributed to altered measurement and the direction matches the quota's intended mechanism. The most valuable addition to Claim 1 is to express the counts as birds per observer-day, or to repeat the survey at the original 20 observer-days, either of which separates detection effort from population change and would let the 30 percent figure be assessed properly.
Scientific references and adapted source figures
- OpenSciEd 7.5 — ecosystem dynamics and public case graphs
- OpenSciEd middle-school source license — CC BY 4.0
Parent / teacher teaching notes
The survey-effort trap in the application is the most transferable idea in the unit, because it appears whenever a measurement regime changes alongside the thing being measured. Keep the five pressures distinct and then ask which response addresses which, since matching a measure to a pressure is the practical skill. On trade-offs, be explicit that evidence estimates consequences while the weighing of costs is a value judgement — that is both accurate and it keeps the discussion from turning into advocacy. Ask for an explanation of each label, arrow and axis before calculation. Keep first and revised models; attempt the changed case before consulting guidance. Distinguish invented instructional records from named historical sources. Source chromosome symbols are allele-category models, not DNA sequences. These independently authored high-school supplements are not the full OpenSciEd teacher editions or an endorsement.
The key idea
Habitat loss, climate change, pollution, and invasive species are driving a dramatic loss of biodiversity — but conservation (protecting and restoring ecosystems) and sustainability (using resources without exhausting them) can reduce human impact and let ecosystems recover.
Worked examples
Example 1
- Draining the wetland destroys and fragments habitat, so species that depend on it — wading birds, fish and shellfish that use it as a nursery, amphibians — lose their homes and their populations decline locally.
- The remaining natural areas nearby become more isolated, cutting off populations and lowering their genetic diversity, which makes them more vulnerable over time.
- Wetlands also perform valuable ecosystem services: they buffer the coast against storm surge and flooding, filter pollutants from water, and store carbon — services that disappear when the wetland is filled.
Example 2 · Worked application
- Movement evidence supports improved connectivity or corridor use.
- Population recovery requires abundance, survival or reproductive evidence.
- Monitor comparable sites and detection effort.
The success measure must match the conservation goal.
Example 3
- Biomagnification multiplies the concentration by about 10 for each step up the food chain.
- Three trophic levels above the algae means three multiplications: 0.01 × 10 × 10 × 10.
- 0.01 × 10 = 0.1; 0.1 × 10 = 1; 1 × 10 = 10.
Example 4
- Sightings suggest corridor use, but detectability and sampling effort matter.
- Population growth needs independent abundance or reproduction evidence.
Example 5 · Find and fix the mistake
- Test the claim against the stated conditions: The success measure must match the conservation goal.
- Effectiveness requires measured outcomes and consideration of unintended effects.
The success measure must match the conservation goal.
Example 6 · Reason from the visual evidence
- Detection probability is the chance of observing a present organism under a sampling method. A count can rise when effort, access, season or tools change even without equal population growth. An intervention evaluation needs baseline and follow-up measurements with suitable comparison sites and comparable methods. Before–after evidence establishes temporal order but does not alone isolate cause. Several indicators can reveal tradeoffs that one abundance measure hides, including condition, reproduction, habitat quality and unintended effects.
- Detection changed with the intervention period and can increase counts; comparable sampling or modeled correction is needed.
Original hypothetical monitoring-confound record, not actual conservation outcome data.
Avoid these mistakes
- A conservation label is not evidence that every ecological goal has been achieved.
Check your understanding
A wildlife corridor increases sightings but population size is unknown. What can be concluded?
Discuss the answer
Use is plausible; population recovery is not established by sightings alone.
Why should conservation monitoring include multiple indicators?
Discuss the answer
Different indicators can expose changes in reproduction, condition, habitat, detection or unintended effects. One increased count does not establish complete lasting recovery.
Return to the phenomenon
Return to the initial case. Does more wildlife observed after a project prove that the project restored the population? Revise your drawing or explanation using two named ideas and one stated limitation.
Compare explanations after your attempt
Conservation needs matched evidence and explicit priorities; temporal order or one increased indicator does not uniquely establish lasting recovery.
What should we investigate next?
Which comparison would test a remaining uncertainty? State what you would change, keep comparable and measure.
Investigate, explain and revise
Complete these tasks after the teaching parts. Preserve your first model and a supported revision; use guidance after a real attempt.
Activity 1 · Return to the opening case
Use the opening question, defined terms, Parts 1–4 and your notebook. The supplied-data route needs no equipment or external account.
Your task
Return to the initial case. Does more wildlife observed after a project prove that the project restored the population? Revise your drawing or explanation using two named ideas and one stated limitation.
Success criteria
- Use relevant stated observations.
- Explain the mechanism with a labeled model.
- Distinguish quantities and assumptions.
- Describe a revision and a useful next test.
Hint
Follow objects, materials and information separately. Check what each measured quantity means.
Response guidance — discuss after your attempt
Conservation needs matched evidence and explicit priorities; temporal order or one increased indicator does not uniquely establish lasting recovery.
Activity 2 · Transfer to a changed case
Cover the worked guidance and use the unit explanations/figures to solve a changed problem.
Your task
After restoration, observed animals rise from 40 to 60, but survey effort doubles. Explain why a 50% recovery claim is not established and suggest a better evaluation.
Success criteria
- Use the stated measurements or conditions, with correct units.
- Connect the result to the biological mechanism or evidence relationship.
- Identify the assumption, model limit or further evidence requested.
Hint
Name the stated conditions, select the relevant mechanism and show intermediate reasoning.
Response guidance — discuss after your attempt
The raw count rises 50%, but changed detection can contribute. Use comparable effort/methods, suitable reference sites and repeated population/condition indicators; estimate detection where appropriate before attributing recovery.
Words to know
- biodiversity
- The variety of life in an area — the number of different species, the genetic variety within them, and the range of ecosystems they form.
- greenhouse gas
- A gas such as carbon dioxide, methane, or water vapor that absorbs and re-radiates heat, warming the lower atmosphere.
- habitat fragmentation
- The breaking of a large, continuous habitat into smaller, isolated patches, usually by roads, farms, or development.
- invasive species
- A non-native species that spreads rapidly in a new ecosystem because it lacks the predators, diseases, or competitors that limited it back home.
- sustainability
- Using resources in a way that meets present needs without using them up or damaging the environment for future generations.
- conservation
- The careful protection and management of ecosystems, species, and natural resources to prevent their loss.
HIPPO: the threats to biodiversity, ranked
Biologist E. O. Wilson popularized a handy mnemonic for the main drivers of extinction, listed in rough order of impact: Habitat destruction, Invasive species, Pollution, human Population growth, and Overharvesting. Habitat loss tops the list by a wide margin, but the threats rarely act alone — a fragmented forest is more vulnerable to invaders, a warming climate worsens pollution's effects, and a species stressed by one factor is far less able to withstand another. Conservation usually means tackling several HIPPO threats at once.
The ozone hole: a global problem the world actually solved
In the 1980s, scientists discovered that chemicals called CFCs — used in refrigerators and spray cans — were tearing a hole in the ozone layer that shields life from harmful ultraviolet radiation. The response was remarkably fast: nearly every nation signed the 1987 Montreal Protocol to phase CFCs out, and the ozone layer is now slowly healing, on track to recover within decades. It stands as proof that coordinated global action on an environmental threat is not just possible but can genuinely work.
Wolves that reshaped a landscape — and its rivers
When gray wolves were reintroduced to Yellowstone National Park in 1995 after a 70-year absence, they did far more than hunt elk. With wolves back, elk avoided lingering in open valleys, so willows and aspen recovered along the streams; beavers returned to the new growth, songbirds followed, and stabilized banks even changed how some rivers flowed. This chain of effects rippling down from a top predator is called a trophic cascade, and it's a vivid demonstration of how a single keystone species can hold an entire ecosystem together.
Extinction is natural — the rate is not
A common objection is that 'extinction happens naturally, so why worry?' It's true that species have always gone extinct at a slow background rate. But today species are vanishing an estimated 100 to 1,000 times faster than that natural pace, and the losses are driven by human activity rather than by asteroids or ice ages. That combination — an extreme rate plus a single dominant cause — is exactly why scientists describe the current crisis as a human-caused sixth mass extinction, not business as usual.
Feedback loops: why early action matters
Climate change is worrying partly because of positive feedback loops that can amplify it. As bright ice melts, it exposes dark water and land that absorb more sunlight, causing more warming and more melting. Thawing Arctic permafrost releases methane, a potent greenhouse gas, which drives still more warming. These self-reinforcing loops mean the system can shift faster the longer we wait, which is why reducing emissions sooner — through renewable energy, protecting carbon-storing forests, and cutting waste — has an outsized payoff compared with acting later.
In the real world
After the pesticide DDT was banned in the United States in 1972 — once biomagnification was shown to be thinning the eggshells of top predators — bald eagle, osprey, and peregrine falcon populations rebounded dramatically, a landmark example of conservation science reversing human damage.
Exit check
Why does a pollutant not automatically biomagnify just because it enters a food web?
Check your explanation after answering
Persistence, uptake, metabolism, excretion, and feeding pathways determine concentration patterns. Biomagnification is substance- and context-dependent, not universal.
Explain your reasoning without notes. If a key idea is missing, revisit the lesson and try again.
Disturbance, Interactions & Ecosystem Change
Learning goals
- I can explain how changing one population can affect several others.
- I can distinguish resistance, recovery, and a changing ecosystem baseline.
Readings for this unit
Before this unit
Trace direct and indirect effects through a food web.
Use three flexible study sessions: core explanation and Parts 1–2; Parts 3–4 with their reasoning checks and models; then the whole-unit application, worked examples, independent practice, and exit check. Allow about 50–60 minutes per session, including diagrams, data work, and notebook explanations. Attempt each check before opening its guidance. Schedule chapter investigations, review, and exams separately; add time where prerequisites are uncertain. Trace the explained visual parts and write a first model, then attempt the illustrated and changed independent cases. In the third session explain a correction and revise the opening account using evidence.
Start with something to explain
Can a system recover its biomass without recovering its earlier community?
Illustrative evidence case. A selected output can return while species composition and interactions remain altered.
Notice and wonder
Record two observations using the stated quantities or relationships. Keep observations separate from possible causes. Write one question that a new measurement could help answer.
Can a system recover its biomass without recovering its earlier community?
Your first model
Label disturbance, resistance, recovery interval and the indicator being measured.
Build the language from the idea
- disturbance
- An event that changes ecosystem conditions or structure.
- resistance
- The degree to which a system remains similar during a disturbance.
- succession
- Changes in community composition over time.
An ecosystem includes interactions among organisms and the physical environment. Competition, predation, mutualism, and other relationships can influence populations. A food web predicts possible pathways, but an arrow alone does not give the size or timing of every response. Alternative foods and other limiting factors matter.
A disturbance can change resources, populations, and conditions. Resistance describes how little a system changes; recovery describes its return after a disturbance. Resilience is used in different ways, so define the measured outcome. A population returning to its earlier count does not necessarily mean every part of the ecosystem has recovered.
Succession describes changes in communities over time. Soil, seed sources, dispersal, climate, and repeated disturbances influence the path. Ecosystems need not progress toward one fixed endpoint. Use time series, comparison sites, and evidence about mechanisms to judge a claim about recovery.
A disturbance can change resources, populations and interactions, producing effects that spread through a system. Removing a predator can alter herbivores and vegetation, but the outcome depends on the full network. Name the mechanism rather than assuming one universal cascade.
Resistance describes limited change during disturbance; recovery describes return afterward. Resilience is used in different ways, so state your operational measure. Recovery of one species count does not necessarily restore the original community or ecosystem functions.
Compare repeated measurements before and after with a reference when possible. Historical variability and repeated disturbances complicate claims of recovery. A useful model identifies thresholds and uncertainties without asserting that every ecosystem has one fixed stable balance.
Build your understanding
Use three flexible study sessions: core explanation and Parts 1–2; Parts 3–4 with their reasoning checks and models; then the whole-unit application, worked examples, independent practice, and exit check. Allow about 50–60 minutes per session, including diagrams, data work, and notebook explanations. Attempt each check before opening its guidance. Schedule chapter investigations, review, and exams separately; add time where prerequisites are uncertain.
Part 1 · Disturbance is normal
A disturbance changes conditions, resources or populations over a specified interval and area. Fire, storms, flooding and human actions can have different roles depending on intensity, frequency and ecosystem history. Some organisms depend on recurring disturbances, while extreme or altered patterns can reduce recovery. A decline in one selected biomass indicator is not the complete measure of all ecological functions. Define the affected system and compare expected historical variability before equating every disturbance with the same kind of damage.
Read the visual model
Identify the labeled structures and units, then trace the arrows or compare values under the caption’s stated conditions. Separate the displayed evidence from a further inference. Write your reasoning before opening the guidance.
Why is “all disturbances are ecologically identical damage” inaccurate?
Visual reasoning — after your attempt
Effects vary with organism adaptations, history, intensity and recurrence; some recurring disturbances support particular ecological processes.
Ecosystems are not static, and disturbance — fire, storm, flood, disease, grazing — is a regular feature rather than an exception. Many communities depend on it: some seeds germinate only after fire, and gaps opened by fallen trees allow light-demanding species to establish. Treating any change as damage misses that the community's composition reflects a history of disturbance.
What distinguishes a damaging disturbance is its scale, frequency, or novelty relative to that history. A fire regime a community is adapted to differs from one several times more frequent, and a disturbance with no precedent — a new pathogen, a novel chemical — is more likely to produce lasting change than a familiar one of similar magnitude.
Pause and explain
Why is it inaccurate to treat all disturbance as damage to an ecosystem?
Check your reasoning after answering
Many communities have developed under recurring disturbance and depend on it, with species whose reproduction or establishment requires fire or gaps. What matters is whether a disturbance's scale, frequency, or type departs from the regime the community developed under.
Part 2 · Succession
Succession is change in community composition through time. Primary succession begins in settings with little developed soil; secondary succession can follow disturbance where soil and biological legacies remain. Soil, seed sources, dispersal, climate and further disturbances affect rates and routes. Secondary recovery can be faster in a relevant comparison, but it is not guaranteed under every condition. Communities need not converge to one fixed universal climax, and species order alone does not establish all underlying interactions.
Read the visual model
Identify the labeled structures and units, then trace the arrows or compare values under the caption’s stated conditions. Separate the displayed evidence from a further inference. Write your reasoning before opening the guidance.
Why can surviving soil and seed sources alter recovery compared with a bare-substrate setting?
Visual reasoning — after your attempt
They preserve material, organisms and establishment opportunities that would otherwise need to develop or arrive.
Succession is the sequence of change in community composition after a disturbance. Primary succession begins where there is no soil — bare rock, a new lava surface — so the first organisms must establish without it, and soil accumulates slowly. Secondary succession begins where soil and often seeds remain, as after a fire or on abandoned farmland, and therefore proceeds much faster.
The sequence is directional but not fixed. Early colonists are typically fast-growing and tolerant of exposure; later species are often slower-growing and more shade-tolerant, and they may exclude the earlier ones. The endpoint is not a single predetermined community, since the outcome depends on which species arrive, on soil and climate, and on further disturbance along the way.
Pause and explain
Why does secondary succession proceed faster than primary succession?
Check your reasoning after answering
Soil is already present, along with seeds, roots, and soil organisms. Primary succession must first build soil from bare rock, which takes a very long time, whereas secondary succession starts with the substrate and often a seed bank already in place.
Part 3 · Resistance and resilience are different properties
Resistance describes how little a system changes during a specified disturbance. Recovery describes return of selected properties afterward. Resilience is used in several related ways, so define the sense and measured variable before comparing systems. A system can change strongly yet recover rapidly, while another changes little but recovers slowly. Returning one output to baseline does not guarantee identical species composition or restored every function. Compare reference variability and the time interval rather than rank ecosystems by one undefined resilience label.
Read the visual model
Identify the labeled structures and units, then trace the arrows or compare values under the caption’s stated conditions. Separate the displayed evidence from a further inference. Write your reasoning before opening the guidance.
Which supplied model has lower resistance but faster recovery?
Visual reasoning — after your attempt
A changes from 100 to 20, then returns to 100 by year four; B changes less but has not returned in that interval.
Two distinct questions can be asked about a community facing disturbance. Resistance asks how little it changes when the disturbance hits — the size of the immediate drop. Resilience asks how quickly and completely it returns afterwards — the time to recover to a stated fraction of its former state.
The two are independent, which is why they must be reported separately. A grassland may lose most of its standing biomass to fire and recover within two seasons: low resistance, high resilience. A mature forest may lose little to a storm but take decades to replace a large tree: higher resistance, lower resilience. A single statement that a community is "stable" conceals which property is meant.
Pause and explain
A community loses 80 percent of its biomass to fire and returns to its former level in three years. Describe it in terms of both properties.
Check your reasoning after answering
It has low resistance, since the initial loss was large, and high resilience, since recovery was rapid and complete. Reporting only one property would describe it as either fragile or robust, both of which would be misleading.
Part 4 · Diversity, redundancy, and limits
Functional redundancy can buffer loss when other organisms supply a relevant function, but effects depend on traits, interactions and conditions rather than species count alone. Thresholds describe changes in response behavior under a specified model; altered soil, resources or feedbacks can make return difficult even after a pressure is removed. Lost source populations, dispersal limits and repeated disturbance also matter. A causal explanation identifies the continuing constraints and tests a restoration pathway rather than assumes biodiversity guarantees rapid return everywhere.
Read the visual model
Identify the labeled structures and units, then trace the arrows or compare values under the caption’s stated conditions. Separate the displayed evidence from a further inference. Write your reasoning before opening the guidance.
Why might removing the original pressure still leave a changed community?
Visual reasoning — after your attempt
Missing source species, altered resources or reinforcing interactions can prevent the earlier state from re-establishing without further changes.
Communities with more species often absorb disturbance better, and the usual explanation is redundancy: where several species perform a similar role, the loss of one can be compensated by the others. Diversity also raises the chance that some species present will tolerate the particular conditions a disturbance creates.
The relationship has limits worth stating. Diversity is not a guarantee, a disturbance can remove many species at once, and some ecosystems shift to a persistently different state rather than returning — a lake that turns turbid and stays turbid, a reef replaced by algae. Such shifts matter because the new state can resist return even after the original pressure is reduced, so recovery is not simply a matter of waiting.
Pause and explain
Why can an ecosystem fail to recover even after the pressure that changed it is removed?
Check your reasoning after answering
It may have shifted to a different state that is self-sustaining, where new conditions or species keep it from returning — turbid water preventing the plants that would clear it, for example. Removing the original pressure is then not sufficient, because the new state maintains itself.
Apply the whole unit · Compare two recovery records
Illustrative recovery data after comparable fires, biomass as a percentage of the pre-fire level, with species richness in brackets. Community A (grassland, 14 species before fire): year 0 after fire 18 percent (5); year 1 62 percent (10); year 3 96 percent (13); year 6 99 percent (14). Community B (woodland, 15 species before fire): year 0 after fire 54 percent (11); year 1 61 percent (12); year 3 70 percent (13); year 6 78 percent (14); year 20 94 percent (15).
Your task
Describe each community in terms of resistance and resilience with figures, calculate how many times longer B takes to reach 94 percent or more than A takes to reach 96 percent, explain why describing either community simply as more stable would be misleading, and state what the species-richness figures add that biomass alone does not. Then name one factor the data cannot distinguish.
What your response should show
- Choose the appropriate biological model or relationship and state the conditions it assumes.
- Show the counts, rates, ratios, or intermediate reasoning the question requires.
- Use the supplied evidence to justify the conclusion and separate observation from inference.
- Identify a meaningful limitation, uncertainty, or next measurement.
Response guidance — after your attempt
Community A resistance: biomass fell to 18 percent immediately, so resistance is low; richness fell from 14 to 5 species.
Community A resilience: 96 percent of pre-fire biomass by year 3 and 13 of 14 species, so resilience is high.
Community B resistance: biomass fell only to 54 percent, so resistance is substantially higher; richness fell from 15 to 11.
Community B resilience: 94 percent reached at year 20, so resilience is much lower.
Ratio: 20 years against 3 years is a factor of about 6.7 for comparable recovery.
Explain the trap: A is less resistant but more resilient and B the reverse, so one label cannot rank them; which matters depends on whether disturbances are frequent or rare.
Interpret richness: biomass can recover while species are still missing, so richness shows whether composition as well as quantity has returned — B regains full richness only at year 20, A by year 6.
Name what is indistinguishable: the data cannot separate intrinsic recovery rate from differences in fire intensity, soil, climate, or seed availability between the two sites.
Community A has low resistance and high resilience: biomass fell to 18 percent and richness from 14 species to 5, but it reached 96 percent of pre-fire biomass with 13 species by year 3. Community B is the opposite — biomass fell only to 54 percent, showing much higher resistance, but it needed 20 years to reach 94 percent, about 6.7 times as long as A took to reach a comparable level. Calling either community more stable would therefore be misleading, because the two properties point in opposite directions, and which matters depends on how often disturbance occurs: A suits a frequently burned landscape, while B's slow recovery makes repeated fires far more consequential. The richness figures add what biomass conceals — B's biomass was at 78 percent by year 6 while one species was still absent, so quantity recovers before composition does. What the data cannot separate is intrinsic recovery capacity from site differences: fire intensity, soil depth, rainfall, and nearby seed sources could each account for part of the contrast, and comparable fires on paired sites would be needed to isolate the communities' own properties.
Scientific references and adapted source figures
Parent / teacher teaching notes
Resistance and resilience are the whole unit, and the two-community comparison makes them impossible to conflate: the community that drops furthest recovers fastest. Insist on figures for both rather than the word "stable." The richness-against-biomass point is the second idea worth securing, because recovery of quantity is routinely reported as recovery of the ecosystem, and the data here show those are not the same thing. Ask for an explanation of each label, arrow and axis before calculation. Keep first and revised models; attempt the changed case before consulting guidance. Distinguish invented instructional records from named historical sources. Source chromosome symbols are allele-category models, not DNA sequences. These independently authored high-school supplements are not the full OpenSciEd teacher editions or an endorsement.
The key idea
Ecosystem change depends on interacting populations, conditions, and history; define what recovery would mean.
Worked examples
Example 1
- Cover has increased from the immediate post-disturbance value.
- It remains below the initial cover.
- Species composition and other functions need separate evidence.
Example 2 · Worked application
- Species richness and soil function measure different properties.
- One has recovered while the other has not.
- A complete claim requires multiple relevant indicators.
Define recovery operationally instead of assuming one universal measure.
Example 3
- Richness is one structural indicator.
- Nutrient retention measures a different function and remains altered.
Example 4 · Find and fix the mistake
- Test the claim against the stated conditions: Define recovery operationally instead of assuming one universal measure.
- Composition, abundance and functions can still differ.
Define recovery operationally instead of assuming one universal measure.
Example 5 · Reason from the visual evidence
- Resistance describes how little a system changes during a specified disturbance. Recovery describes return of selected properties afterward. Resilience is used in several related ways, so define the sense and measured variable before comparing systems. A system can change strongly yet recover rapidly, while another changes little but recovers slowly. Returning one output to baseline does not guarantee identical species composition or restored every function. Compare reference variability and the time interval rather than rank ecosystems by one undefined resilience label.
- A changes from 100 to 20, then returns to 100 by year four; B changes less but has not returned in that interval.
Original resistance/recovery comparison with arbitrary output indices, not complete ecosystem restoration evidence.
Avoid these mistakes
- Ecosystems are dynamic, and returning to one indicator's old value need not mean complete recovery.
Check your understanding
After a flood, species richness returns but nutrient retention remains low. Has every function recovered?
Discuss the answer
No; different indicators reveal different aspects of recovery.
Why can a food-web change have indirect effects on organisms not directly involved?
Discuss the answer
Changes in one population can alter resource use or other partners, sending indirect effects through the network. Link evidence to mechanisms rather than infer only direct interactions.
Return to the phenomenon
Return to the initial case. Can a system recover its biomass without recovering its earlier community? Revise your drawing or explanation using two named ideas and one stated limitation.
Compare explanations after your attempt
Response and recovery are separate; multiple indicators, initial legacies and continuing feedbacks determine what restoration evidence means.
What should we investigate next?
Which comparison would test a remaining uncertainty? State what you would change, keep comparable and measure.
Investigate, explain and revise
Complete these tasks after the teaching parts. Preserve your first model and a supported revision; use guidance after a real attempt.
Activity 1 · Return to the opening case
Use the opening question, defined terms, Parts 1–4 and your notebook. The supplied-data route needs no equipment or external account.
Your task
Return to the initial case. Can a system recover its biomass without recovering its earlier community? Revise your drawing or explanation using two named ideas and one stated limitation.
Success criteria
- Use relevant stated observations.
- Explain the mechanism with a labeled model.
- Distinguish quantities and assumptions.
- Describe a revision and a useful next test.
Hint
Follow objects, materials and information separately. Check what each measured quantity means.
Response guidance — discuss after your attempt
Response and recovery are separate; multiple indicators, initial legacies and continuing feedbacks determine what restoration evidence means.
Activity 2 · Transfer to a changed case
Cover the worked guidance and use the unit explanations/figures to solve a changed problem.
Your task
A supplied system loses 80% of its output during disturbance and returns to its initial output after three years. Describe resistance and recovery and explain one limit of that evidence.
Success criteria
- Use the stated measurements or conditions, with correct units.
- Connect the result to the biological mechanism or evidence relationship.
- Identify the assumption, model limit or further evidence requested.
Hint
Name the stated conditions, select the relevant mechanism and show intermediate reasoning.
Response guidance — discuss after your attempt
It has low resistance for this disturbance/output but relatively rapid recovery over the stated interval. Output recovery alone does not establish restored species composition or every ecological function.
Words to know
- disturbance
- An event that changes ecosystem conditions or structure.
- resistance
- The degree to which a system remains similar during a disturbance.
- succession
- Changes in community composition over time.
In the real world
Exit check
Why should a prediction after disturbance include uncertainty?
Check your explanation after answering
Resources, dispersal, interactions, climate, and later disturbances can change the response.
Explain your reasoning without notes. If a key idea is missing, revisit the lesson and try again.
Biodiversity Evidence & Conservation Design
Learning goals
- I can compare biodiversity using standardized sampling and more than one measure.
- I can evaluate a conservation proposal against criteria, constraints, and tradeoffs.
Readings for this unit
Before this unit
Calculate sample proportions and identify a fair comparison.
Use three flexible study sessions: core explanation and Parts 1–2; Parts 3–4 with their reasoning checks and models; then the whole-unit application, worked examples, independent practice, and exit check. Allow about 50–60 minutes per session, including diagrams, data work, and notebook explanations. Attempt each check before opening its guidance. Schedule chapter investigations, review, and exams separately; add time where prerequisites are uncertain. Trace the explained visual parts and write a first model, then attempt the illustrated and changed independent cases. In the third session explain a correction and revise the opening account using evidence.
Start with something to explain
How can equal-area designs have different conservation outcomes?
Illustrative evidence case. Shape, boundary exposure, connections and the matched threat influence whether organisms can use habitat.
Notice and wonder
Record two observations using the stated quantities or relationships. Keep observations separate from possible causes. Write one question that a new measurement could help answer.
How can equal-area designs have different conservation outcomes?
Your first model
State goals, constraints, dimensions, indicators and a revision criterion.
Build the language from the idea
- species richness
- The number of species recorded in a defined sample.
- evenness
- How equally abundance is distributed across sampled species.
- constraint
- A limit a proposed design must satisfy.
Species richness counts species observed; evenness describes how individuals are distributed among them. Two samples can have equal richness but different evenness. Standardize sampling area, effort, season, and methods before comparing sites. An observed count is not a complete census of every organism present.
Conservation decisions combine biological evidence with goals and constraints. A project may protect habitat, reduce pollution, connect isolated patches, or manage harvest. Define success quantitatively, consider effects on people and other species, and compare alternatives. A connected corridor may help some organisms move but can have context-dependent costs.
Test a design with monitoring before and after implementation and suitable comparison sites where possible. A change after an intervention may also reflect weather, sampling, or other causes. Revisit the design using evidence, acknowledge uncertainty, and explain which tradeoffs justify the choice.
A biodiversity survey needs a defined area, sampling method and effort. Detection varies among species and conditions, so absence from a small sample does not establish true absence. Repeat and compare equivalent effort before interpreting site differences.
Design solutions from evidence about the threat. A corridor may address isolation, while runoff control addresses pollutant inputs. One solution rarely fixes every problem. Use criteria such as habitat quality, connectivity, feasibility and effects on nearby communities.
A proposal should predict measurable outcomes and state when monitoring occurs. If the result differs, examine the mechanism, sampling and new conditions before redesigning. Scientific revision turns a promising idea into an evaluated intervention rather than a claim based on intention alone.
Build your understanding
Use three flexible study sessions: core explanation and Parts 1–2; Parts 3–4 with their reasoning checks and models; then the whole-unit application, worked examples, independent practice, and exit check. Allow about 50–60 minutes per session, including diagrams, data work, and notebook explanations. Attempt each check before opening its guidance. Schedule chapter investigations, review, and exams separately; add time where prerequisites are uncertain.
Part 1 · A decision needs a stated objective
A design objective states what improvement is sought and how evidence will assess it. Quantitative measures can make comparison clear, but qualitative criteria can also be useful when systematically defined and evaluated. Constraints include resources, access, maintenance or other limits. Choose indicators that match the purpose rather than a convenient count unrelated to the threat. State the population, location, interval and affected groups so a proposal can be inspected and revised rather than declared successful by a vague word such as better.
Read the visual model
Identify the labeled structures and units, then trace the arrows or compare values under the caption’s stated conditions. Separate the displayed evidence from a further inference. Write your reasoning before opening the guidance.
Must every conservation objective be only a single quantitative score?
Visual reasoning — after your attempt
No. It must be assessable; well-defined qualitative criteria and multiple quantitative indicators can both contribute.
Conservation design begins with what is being conserved and to what standard — a particular species' breeding population, the area of a habitat type, the connectivity of a landscape, or the functioning of a process such as pollination. Different objectives point to different designs, so an unstated objective makes a plan impossible to evaluate.
The objective must also be measurable. "Protect biodiversity" cannot be assessed; "maintain at least 60 breeding pairs across the reserve network, measured by annual survey at constant effort" can. Making the objective quantitative is what allows anyone, later, to tell whether the plan succeeded.
Pause and explain
Why must a conservation objective specify how its outcome will be evaluated? Does every useful criterion have to be one numerical score?
Check your reasoning after answering
An assessable objective supports transparent comparison, monitoring and revision. Quantitative measures help, while clearly defined qualitative criteria and multiple indicators can also be useful.
Part 2 · Size, shape, and connection
A perimeter measures boundary length, while area measures enclosed space. The supplied 150×150 m square and 300×75 m rectangle each enclose 22,500 m², but their perimeters are 600 and 750 m. Edge exposure can change microclimate, access and interactions; it is not universally harmful or beneficial to every species. A narrow patch can also be useful as a corridor. Compare habitat quality, dispersal and goals rather than deciding design only from area or a simple shape preference.
Read the visual model
Identify the labeled structures and units, then trace the arrows or compare values under the caption’s stated conditions. Separate the displayed evidence from a further inference. Write your reasoning before opening the guidance.
Why might equal area fail to provide equal usable core habitat?
Visual reasoning — after your attempt
Different perimeter/width and edge conditions can alter the interior habitat available to a particular organism.
Three design properties recur. Area determines how large a population can be supported, and larger populations are less vulnerable to chance extinction and to loss of variation. Shape determines the ratio of edge to interior, and compact areas preserve more interior conditions than long thin ones of the same area. Connection determines whether individuals can move between patches, maintaining gene flow and allowing recolonization.
These properties trade off against cost and against each other, and against the risk of a single catastrophe affecting one large reserve. There is no universally correct configuration: the right design depends on the species' area requirements and mobility, the threats expected, and what land is actually available. Stating those dependencies is part of the design rather than an afterthought.
Pause and explain
Two reserves have equal area but one is long and narrow. Why might it conserve less?
Check your reasoning after answering
A long narrow reserve has far more edge relative to its interior, so a larger proportion is exposed to outside conditions, disturbance, and invading species. Species requiring interior conditions have less usable habitat than the total area suggests.
Part 3 · Indicators and monitoring
A monitoring criterion states what result would support progress, reveal failure or trigger revision. Reference sites help distinguish intervention effects from broader changes, though they need comparable conditions and sampling. A before–after difference can be misleading when weather, detection or other pressures also change. Record methods, repeated observations and uncertainty before selecting favorable outcomes. A project’s activity count, such as materials installed, is not automatically evidence that the desired ecological mechanism occurred.
Read the visual model
Identify the labeled structures and units, then trace the arrows or compare values under the caption’s stated conditions. Separate the displayed evidence from a further inference. Write your reasoning before opening the guidance.
Why should failure/revision criteria be written before the outcome is known?
Visual reasoning — after your attempt
This limits selecting only favorable measures afterward and makes the evaluation transparent and testable.
A plan needs an indicator that can be measured consistently: a population count at fixed effort, the area of a habitat type from imagery, the presence of a species sensitive to the conditions of concern. The indicator should respond to what the plan is trying to change, and it must be measured the same way before and after, since a change in method produces a change in the number regardless of what happened in the field.
Monitoring also needs a schedule and a decision rule stated in advance — what will be measured, how often, and what result will trigger a change of approach. Without a rule set beforehand, results tend to be interpreted favourably after the fact, and a plan can continue for years without anyone establishing whether it works.
Pause and explain
Why should the result that would count as failure be stated before monitoring begins?
Check your reasoning after answering
Stating it in advance prevents the outcome from being reinterpreted as success after the fact, and it commits the plan to a change of approach if the target is not met. A rule set afterwards can be adjusted to whatever the data show.
Part 4 · Cost, uncertainty, and who decides
A tradeoff is a comparison among outcomes that may not improve together. A design can satisfy a cost constraint while performing poorly on habitat or maintenance criteria. Uncertainty concerns what is not known about outcomes or assumptions; it should be presented with scenarios, evidence gaps and a monitoring plan rather than hidden behind one exact score. Discuss who bears costs and benefits. Choosing among feasible designs includes values as well as ecological evidence, and revision remains part of responsible evaluation.
Read the visual model
Identify the labeled structures and units, then trace the arrows or compare values under the caption’s stated conditions. Separate the displayed evidence from a further inference. Write your reasoning before opening the guidance.
Does the cheapest feasible design automatically best meet the biological objective?
Visual reasoning — after your attempt
No. Compare effectiveness, durability, access, uncertainties and the stated priorities under the constraints.
Plans have costs — purchase, management, monitoring, and foregone human use — and those costs fall on particular people, often not the ones who gain the benefit. Comparing plans therefore means comparing expected outcomes against total costs over time, not comparing area or price alone. Cost per hectare is a particularly weak measure, since hectares differ enormously in what they contribute.
Expected outcomes are uncertain, and the honest presentation gives a range rather than a single figure, with the reasons for the uncertainty. Evidence can establish what each option is likely to produce and how confidently; it cannot settle how much present cost is worth bearing for a future benefit, which is a judgement for the people affected. A good analysis makes the choice visible instead of burying it in a recommendation.
Pause and explain
What should an analysis present when the expected outcome of a plan is uncertain?
Check your reasoning after answering
A range of plausible outcomes with the reasons for the uncertainty, rather than a single number, together with what would reduce that uncertainty. The decision then rests on explicit information rather than on false precision.
Apply the whole unit · Choose between two reserve plans
Illustrative proposals for one landscape, for a bird needing interior forest with a minimum breeding territory of 12 hectares. Plan A: one compact block of 900 ha, estimated 160 ha of edge-affected habitat, no corridor needed, purchase 450,000 dollars, annual management 28,000 dollars. Plan B: four separate blocks totalling 1,400 ha, estimated 520 ha of edge-affected habitat, corridors costing 120,000 dollars to establish, purchase 980,000 dollars, annual management 61,000 dollars. A single wildfire in this landscape typically burns 300 to 700 ha.
Your task
Calculate the interior habitat each plan provides and the number of territories each could support, calculate each plan's cost per hectare of interior habitat including corridors, state which plan you would recommend for this species and why, and explain how the wildfire information affects the comparison. Then state the uncertainty that most affects your recommendation.
What your response should show
- Choose the appropriate biological model or relationship and state the conditions it assumes.
- Show the counts, rates, ratios, or intermediate reasoning the question requires.
- Use the supplied evidence to justify the conclusion and separate observation from inference.
- Identify a meaningful limitation, uncertainty, or next measurement.
Response guidance — after your attempt
Plan A interior: 900 − 160 = 740 ha; territories = 740 / 12 ≈ 61.
Plan B interior: 1,400 − 520 = 880 ha; territories = 880 / 12 ≈ 73.
Plan A cost: 450,000 purchase, so 450,000 / 740 ≈ 608 dollars per hectare of interior habitat, plus 28,000 a year.
Plan B cost: 980,000 + 120,000 corridors = 1,100,000, so 1,100,000 / 880 = 1,250 dollars per hectare of interior habitat, plus 61,000 a year.
Compare: B provides about 20 percent more interior habitat and territories at roughly twice the cost per interior hectare and more than twice the annual management.
Apply the fire information: a typical fire of 300 to 700 ha could affect most of Plan A's single block at once, whereas Plan B's four separate blocks make simultaneous loss unlikely, so B spreads catastrophic risk.
Recommend with the reasoning explicit: for a species needing interior forest, B's larger interior area and lower catastrophic risk favour it if the budget allows, while A is markedly more cost-effective per interior hectare if it does not.
Name the key uncertainty: the edge-affected estimates, since a modest error in how far edge effects penetrate changes the interior figures and could reverse the comparison.
Plan A provides 740 hectares of interior habitat, about 61 territories, at roughly 608 dollars per interior hectare plus 28,000 a year. Plan B provides 880 hectares and about 73 territories, but at 1,250 dollars per interior hectare once corridors are included, plus 61,000 a year — roughly twice the cost per interior hectare for about 20 percent more habitat. The wildfire information matters more than the cost difference: a typical 300 to 700 hectare fire could burn most of Plan A's single 900-hectare block at once, while four separated blocks are unlikely to be lost simultaneously, so Plan B protects against the loss that would end the population outright. On that basis I would recommend Plan B where the budget permits, and Plan A where it does not, stating plainly that the choice turns on how much weight is given to catastrophic risk against cost. The estimates of edge-affected habitat are the largest uncertainty: they are modelled rather than measured, and if edge effects penetrate further than assumed, both interior figures fall and Plan B's advantage in interior area could disappear. Measuring edge penetration directly in existing forest patches would be the first thing to do before committing.
Scientific references and adapted source figures
- OpenSciEd 7.5 — ecosystem dynamics and public case graphs
- OpenSciEd middle-school source license — CC BY 4.0
Parent / teacher teaching notes
This unit is where the course's reasoning habits are applied to a decision, so judge the answer by whether the objective, the evidence, the uncertainty, and the cost-bearer are all named — not by which plan is chosen. The cost-per-interior-hectare calculation is the one worth insisting on, because cost per hectare of land is the figure usually quoted and it is the wrong denominator. Keep the recommendation and the value judgement visibly separate: evidence shows what each plan is likely to deliver, and how much present cost is worth bearing is not a scientific question. Ask for an explanation of each label, arrow and axis before calculation. Keep first and revised models; attempt the changed case before consulting guidance. Distinguish invented instructional records from named historical sources. Source chromosome symbols are allele-category models, not DNA sequences. These independently authored high-school supplements are not the full OpenSciEd teacher editions or an endorsement.
The key idea
Comparable sampling and explicit goals make biodiversity evidence useful for evaluating a conservation design.
Worked examples
Example 1
- Richness is four in both samples.
- A distributes individuals equally; B is dominated by one species.
Example 2 · Worked application
- Sampling effort differs.
- More effort can detect additional species even at the same true richness.
- Standardize or account for effort and detection.
Observed count is not automatically total species present.
Example 3
- Sampling effort differs and rare species need time to detect.
- Use comparable effort or a method that accounts for detection before ranking.
Example 4 · Find and fix the mistake
- Test the claim against the stated conditions: Observed count is not automatically total species present.
- Limited sampling and imperfect detection can miss present species.
Observed count is not automatically total species present.
Example 5 · Reason from the visual evidence
- A monitoring criterion states what result would support progress, reveal failure or trigger revision. Reference sites help distinguish intervention effects from broader changes, though they need comparable conditions and sampling. A before–after difference can be misleading when weather, detection or other pressures also change. Record methods, repeated observations and uncertainty before selecting favorable outcomes. A project’s activity count, such as materials installed, is not automatically evidence that the desired ecological mechanism occurred.
- This limits selecting only favorable measures afterward and makes the evaluation transparent and testable.
Original matched-monitoring illustration, not an estimate of a real restoration effect.
Avoid these mistakes
- A larger species count under greater sampling effort does not automatically prove a more diverse site.
Check your understanding
Site A yields 12 species in 1 h; B yields 18 in 4 h. Can you confidently rank their richness?
Discuss the answer
No confident ranking follows from these counts alone.
Why must a conservation intervention match the particular threat being measured?
Discuss the answer
An intervention must affect the actual limiting pressure or process. A corridor, harvest limit and nutrient-control design address different mechanisms and need matched outcome evidence.
Return to the phenomenon
Return to the initial case. How can equal-area designs have different conservation outcomes? Revise your drawing or explanation using two named ideas and one stated limitation.
Compare explanations after your attempt
Evidence tests a design’s mechanism and limits; area, cost or one favorable observation alone does not decide all outcomes.
What should we investigate next?
Which comparison would test a remaining uncertainty? State what you would change, keep comparable and measure.
Investigate, explain and revise
Complete these tasks after the teaching parts. Preserve your first model and a supported revision; use guidance after a real attempt.
Activity 1 · Return to the opening case
Use the opening question, defined terms, Parts 1–4 and your notebook. The supplied-data route needs no equipment or external account.
Your task
Return to the initial case. How can equal-area designs have different conservation outcomes? Revise your drawing or explanation using two named ideas and one stated limitation.
Success criteria
- Use relevant stated observations.
- Explain the mechanism with a labeled model.
- Distinguish quantities and assumptions.
- Describe a revision and a useful next test.
Hint
Follow objects, materials and information separately. Check what each measured quantity means.
Response guidance — discuss after your attempt
Evidence tests a design’s mechanism and limits; area, cost or one favorable observation alone does not decide all outcomes.
Activity 2 · Transfer to a changed case
Cover the worked guidance and use the unit explanations/figures to solve a changed problem.
Your task
Two equal-area reserves have dimensions 100×100 m and 200×50 m. Find their perimeters and explain why shape alone cannot select the best design.
Success criteria
- Use the stated measurements or conditions, with correct units.
- Connect the result to the biological mechanism or evidence relationship.
- Identify the assumption, model limit or further evidence requested.
Hint
Name the stated conditions, select the relevant mechanism and show intermediate reasoning.
Response guidance — discuss after your attempt
Their areas are 10,000 m² and perimeters 400 versus 500 m. Boundary exposure and width differ, but species, habitat quality, connectivity, disturbance, costs and goals determine the useful comparison.
Words to know
- species richness
- The number of species recorded in a defined sample.
- evenness
- How equally abundance is distributed across sampled species.
- constraint
- A limit a proposed design must satisfy.
In the real world
Exit check
State one conservation goal and a matching measurement.
Check your explanation after answering
For example, maintain native species richness under standardized surveys over several years, while also tracking abundance and habitat condition.
Explain your reasoning without notes. If a key idea is missing, revisit the lesson and try again.
Problem 1
Answer and explanation
A population is all the members of one species in an area (for example, all the gray squirrels in a forest); a community is all the different populations living together there (the squirrels, oaks, hawks, fungi, and every other species combined).
A population is limited to a single species — such as every gray squirrel in the forest — while a community includes every population of every species sharing that space. The community is essentially all the living things interacting in one area; add the nonliving surroundings and you have an ecosystem.
Problem 2
Answer and explanation
400 rabbits.
Exponential doubling follows N = N₀ × 2ⁿ. Here N₀ = 25 and n = 4, so N = 25 × 2⁴ = 25 × 16 = 400 rabbits. In reality, limiting factors would slow this J-curve into an S-curve long before the numbers grew this large.
Problem 3
Answer and explanation
(a) density-dependent, (b) density-independent, (c) density-dependent, (d) density-independent.
Density-dependent factors get stronger as a population becomes more crowded: disease spreads faster in a dense herd (a), and competition for food intensifies when many individuals share limited resources (c). Density-independent factors strike regardless of crowding: a hard freeze (b) and a wildfire (d) can kill the same fraction of a sparse or a dense population.
Problem 4
Answer and explanation
Oak tree: autotroph. Deer and hawk: heterotrophs (consumers). Soil fungus: decomposer (a type of heterotroph).
The oak tree makes its own food by photosynthesis, so it is an autotroph (producer). The deer and hawk both get energy by eating other organisms, so they are heterotrophs. The soil fungus feeds on dead material, breaking it down and recycling nutrients, so it is a decomposer — a specialized heterotroph.
Problem 5
Answer and explanation
8,000 kcal for primary consumers; 800 kcal for secondary consumers.
Primary consumers receive about 10% of the producers' energy: 80,000 × 0.10 = 8,000 kcal. Secondary consumers receive about 10% of that: 8,000 × 0.10 = 800 kcal. Roughly 90% is lost as heat or used for life processes at each step.
Problem 6
Answer and explanation
About 15,000 kcal.
There are three energy transfers from the producers up to the top predator, and each step keeps only about 10% (÷10). Running the rule backward multiplies by 10 for each step down: 15 × 10 × 10 × 10 = 15,000 kcal. It takes a huge energy base at the bottom to support just 15 kcal at the top.
Problem 7
Answer and explanation
Photosynthesis; the carbon is built into sugars that become part of the plant's tissues and can then travel up the food web.
During photosynthesis, plants absorb carbon dioxide and use light energy to combine it with water, building sugar molecules. That carbon becomes part of the plant's own body, and when animals eat the plant, the carbon moves up the food web.
Problem 8
Answer and explanation
Nitrogen gas (N₂) has a strong triple bond that plants can't break, so they can't absorb it from the air. Nitrogen-fixing bacteria (and lightning) convert N₂ into ammonia and nitrates that plant roots can absorb.
Atmospheric nitrogen exists as N₂, whose two atoms are held by a very strong triple bond. Plants have no way to break that bond, so they cannot use nitrogen gas directly. Instead, nitrogen fixation — carried out mainly by bacteria such as Rhizobium in legume root nodules, plus some fixation by lightning — converts N₂ into ammonia and nitrates. Plants absorb those nitrates from the soil and build them into proteins and DNA.
Problem 9
Answer and explanation
The added nutrients trigger an algae bloom; when the algae die, decomposer bacteria multiply and use up the dissolved oxygen; without oxygen, the fish suffocate. This is eutrophication.
The fertilizer adds a surge of nitrogen (and phosphorus) to the lake, fueling an explosive bloom of algae across the surface. The bloom eventually dies, and decomposer bacteria feed on the mass of dead algae, multiplying rapidly. As they respire, these bacteria consume the oxygen dissolved in the water. The dissolved-oxygen level drops so low that fish and other aquatic animals can no longer breathe and die off. This whole nutrient-driven chain of events is called eutrophication, and it shows how disrupting the nitrogen cycle can destabilize an entire ecosystem.
Problem 10
Answer and explanation
Habitat loss, pollution, invasive species, and climate change. Habitat loss (and fragmentation) causes the most extinctions.
Human activity threatens biodiversity mainly through habitat loss and fragmentation, pollution, invasive species, and climate change (overharvesting is often added as a fifth). Of these, destroying and fragmenting habitat removes the places species need to live and is the single largest driver of species loss.
Problem 11
Answer and explanation
10 ppm. Because the toxin concentrates about tenfold at each level, top predators accumulate the highest, most dangerous doses.
Each step up the food web multiplies the concentration by about 10, so two levels up gives 0.1 × 10 × 10 = 10 ppm — a hundredfold increase over the plankton. Since top predators eat many contaminated prey and the toxin doesn't break down, biomagnification loads the greatest concentration into the animals at the top of the food web, which is why species like eagles and large fish are hit hardest.
Problem 12
Answer and explanation
(a) It grows nearly exponentially at first, since the usual limiting factors are absent; (b) native fish decline from added predation and competition, and the effects can ripple through the food web; (c) managers could remove the invasive fish, restrict boat/bait transfers to prevent spread, or protect and restore native habitat.
(a) Freed from the predators, parasites, and competitors that limited it in its home range, the invasive fish faces few density-dependent brakes, so its population can climb along a steep, nearly exponential J-curve. (b) As its numbers explode, it competes with native fish for food and space and preys on them directly, driving native populations down; because food webs are interconnected, species that depended on those natives — or that the invader now outcompetes — can be affected too, lowering biodiversity. (c) Because the lake's usual limiting factors don't apply to the newcomer, managers must supply the 'brakes' themselves: physically removing or culling the invasive fish, preventing its spread to other lakes by cleaning boats and banning its use as bait, and restoring native habitat to help native populations recover. This capstone ties together population growth, limiting factors, species interactions, and conservation.
Problem 13
Answer and explanation
850
The level at which growth stops is the best available estimate of carrying capacity under the conditions observed, which may change if resources change.
Problem 14
Answer and explanation
They compete, and several outcomes are possible: one species may be excluded locally, or the two may divide the resource by feeding at different heights, times, or on different insect sizes, which reduces direct competition. Which occurs depends on how similar their requirements are, whether variation exists that allows divergence, and whether the resource is abundant enough to support both. Measuring where and when each species actually feeds would distinguish exclusion from resource division.
Response criteria
- State a biologically accurate conclusion.
- Show the data, mechanism, or calculation that supports it.
- Include units, conditions, or limits where relevant.
Problem 15
Answer and explanation
Final count is 80+20−12+9−5 = 92. Change is +12, or 12/80×100 = 15%, under the stated boundary and interval.
Final count is 80+20−12+9−5 = 92. Change is +12, or 12/80×100 = 15%, under the stated boundary and interval.
Response criteria
- Use the stated measurements or conditions, with correct units.
- Connect the result to the biological mechanism or evidence relationship.
- Identify the assumption, model limit or further evidence requested.
Problem 16
Answer and explanation
9 %
45 / 500 × 100 = 9 percent, close to the commonly cited approximation of about 10 percent.
Problem 17
Answer and explanation
In a simple chain, losing the single prey species removes the predator's entire food supply, so the predator's population collapses. With three prey species, the predator can shift its feeding to the remaining two, so its population may decline without collapsing. That alternative pathway makes the web more able to absorb the loss, although pressure on the remaining prey species increases, which can cause further changes. Redundancy in feeding relationships therefore spreads the effect rather than eliminating it.
Response criteria
- State a biologically accurate conclusion.
- Show the data, mechanism, or calculation that supports it.
- Include units, conditions, or limits where relevant.
Problem 18
Answer and explanation
The outputs are 1,200 kJ and 96 kJ. The stated transfer fractions define this comparison; ten percent is an approximation, not a compulsory constant.
The outputs are 1,200 kJ and 96 kJ. The stated transfer fractions define this comparison; ten percent is an approximation, not a compulsory constant.
Response criteria
- Use the stated measurements or conditions, with correct units.
- Connect the result to the biological mechanism or evidence relationship.
- Identify the assumption, model limit or further evidence requested.
Problem 19
Answer and explanation
8 units
220 − 212 = 8 units added per year; a reservoir grows whenever inputs exceed outputs, however small the difference.
Problem 20
Answer and explanation
Atoms are conserved and can be reused indefinitely, so carbon, nitrogen, and phosphorus pass repeatedly between organisms, air, water, and soil, with decomposers returning elements from dead material to inorganic forms producers can take up. Energy is conserved in total but degrades at each transformation, with part released as heat that disperses and can no longer do cellular work. An ecosystem therefore needs no continuing input of matter but does need a continuing input of energy, which is why sunlight must keep arriving.
Response criteria
- State a biologically accurate conclusion.
- Show the data, mechanism, or calculation that supports it.
- Include units, conditions, or limits where relevant.
Problem 21
Answer and explanation
The final store is 50+4×(12−9)=62 units. Twelve units/year is an input flux, not the stock or net annual gain; the net gain is three units/year.
The final store is 50+4×(12−9)=62 units. Twelve units/year is an input flux, not the stock or net annual gain; the net gain is three units/year.
Response criteria
- Use the stated measurements or conditions, with correct units.
- Connect the result to the biological mechanism or evidence relationship.
- Identify the assumption, model limit or further evidence requested.
Problem 22
Answer and explanation
30 %
(312 − 240) / 240 × 100 = 30 percent. The comparison population's 18 percent decline is what makes the increase attributable to protection rather than to a favourable period.
Problem 23
Answer and explanation
The conclusion needs a comparison: an unprotected population or an earlier period monitored with the same method, so that the rise can be separated from a general trend. Alternative explanations include favourable weather or food supply across the whole region, a change in counting method or effort that detects more individuals, immigration from outside the protected area, and natural fluctuation in a population that varies year to year. Without a comparison, none of these can be ruled out.
Response criteria
- State a biologically accurate conclusion.
- Show the data, mechanism, or calculation that supports it.
- Include units, conditions, or limits where relevant.
Problem 24
Answer and explanation
The raw count rises 50%, but changed detection can contribute. Use comparable effort/methods, suitable reference sites and repeated population/condition indicators; estimate detection where appropriate before attributing recovery.
The raw count rises 50%, but changed detection can contribute. Use comparable effort/methods, suitable reference sites and repeated population/condition indicators; estimate detection where appropriate before attributing recovery.
Response criteria
- Use the stated measurements or conditions, with correct units.
- Connect the result to the biological mechanism or evidence relationship.
- Identify the assumption, model limit or further evidence requested.
Problem 25
Answer and explanation
Track native plant cover across years and matched sites; it does not alone measure species diversity, soil function, or all populations.
Problem 26
Answer and explanation
3
36 / 12 = 3 times as long, indicating lower resilience in the second community.
Problem 27
Answer and explanation
Resistance is how little a community changes when a disturbance occurs; resilience is how quickly and fully it returns afterwards. Resistance is measured as the size of the initial drop — for example the percentage of biomass or species lost immediately after a storm. Resilience is measured as the time taken to recover to a stated fraction of the pre-disturbance level, such as years to reach 95 percent of former biomass. A community can be low in resistance and high in resilience, dropping sharply and recovering fast, so the two must be reported separately.
Response criteria
- State a biologically accurate conclusion.
- Show the data, mechanism, or calculation that supports it.
- Include units, conditions, or limits where relevant.
Problem 28
Answer and explanation
It has low resistance for this disturbance/output but relatively rapid recovery over the stated interval. Output recovery alone does not establish restored species composition or every ecological function.
It has low resistance for this disturbance/output but relatively rapid recovery over the stated interval. Output recovery alone does not establish restored species composition or every ecological function.
Response criteria
- Use the stated measurements or conditions, with correct units.
- Connect the result to the biological mechanism or evidence relationship.
- Identify the assumption, model limit or further evidence requested.
Problem 29
Answer and explanation
Use consistent sampling, comparison sites, repeated seasons, movement or reproduction evidence, and consideration of weather and other interventions.
Problem 30
Answer and explanation
500 $/ha
450,000 / 900 = 500 dollars per hectare, against 700 for Plan B — though cost per hectare alone does not establish which plan conserves more.
Problem 31
Answer and explanation
Hectares are not interchangeable. A cheaper hectare may be of lower habitat quality, poorly connected to other protected land, or less used by the species of concern, while an expensive hectare may contain the only breeding sites. Cost per hectare also ignores ongoing costs of management and monitoring, the risk that protection fails, and who bears the cost. A defensible comparison states what each plan is expected to achieve for the species or community concerned, with what uncertainty, and at what total cost over time.
Response criteria
- State a biologically accurate conclusion.
- Show the data, mechanism, or calculation that supports it.
- Include units, conditions, or limits where relevant.
Problem 32
Answer and explanation
Their areas are 10,000 m² and perimeters 400 versus 500 m. Boundary exposure and width differ, but species, habitat quality, connectivity, disturbance, costs and goals determine the useful comparison.
Their areas are 10,000 m² and perimeters 400 versus 500 m. Boundary exposure and width differ, but species, habitat quality, connectivity, disturbance, costs and goals determine the useful comparison.
Response criteria
- Use the stated measurements or conditions, with correct units.
- Connect the result to the biological mechanism or evidence relationship.
- Identify the assumption, model limit or further evidence requested.