Biodiversity Loss · Grade 12 Science
Chapter: Conservation, Systems & Environmental DesignBiodiversity Loss
Learning goals
- I can define biodiversity and explain why it matters to ecosystems and to people.
- I can identify the major human-caused drivers of biodiversity loss.
- I can explain why the current rate of extinction concerns scientists.
Readings for this unit
Before this unit
Habitat, population, diversity, and fragmentation.
Use the detailed parent plan: two core 50–60-minute sessions per focused unit, with a third assigned for selected calculation/modeling topics. First study the core explanation and Parts 1–2 with their figures/checks; next study Parts 3–4, the whole-unit application, worked cases, varied practice and exit check. Attempt reasoning before opening guidance. Extend time when actual understanding requires it; investigations and chapter assessments have separate sessions.
Start with something to explain
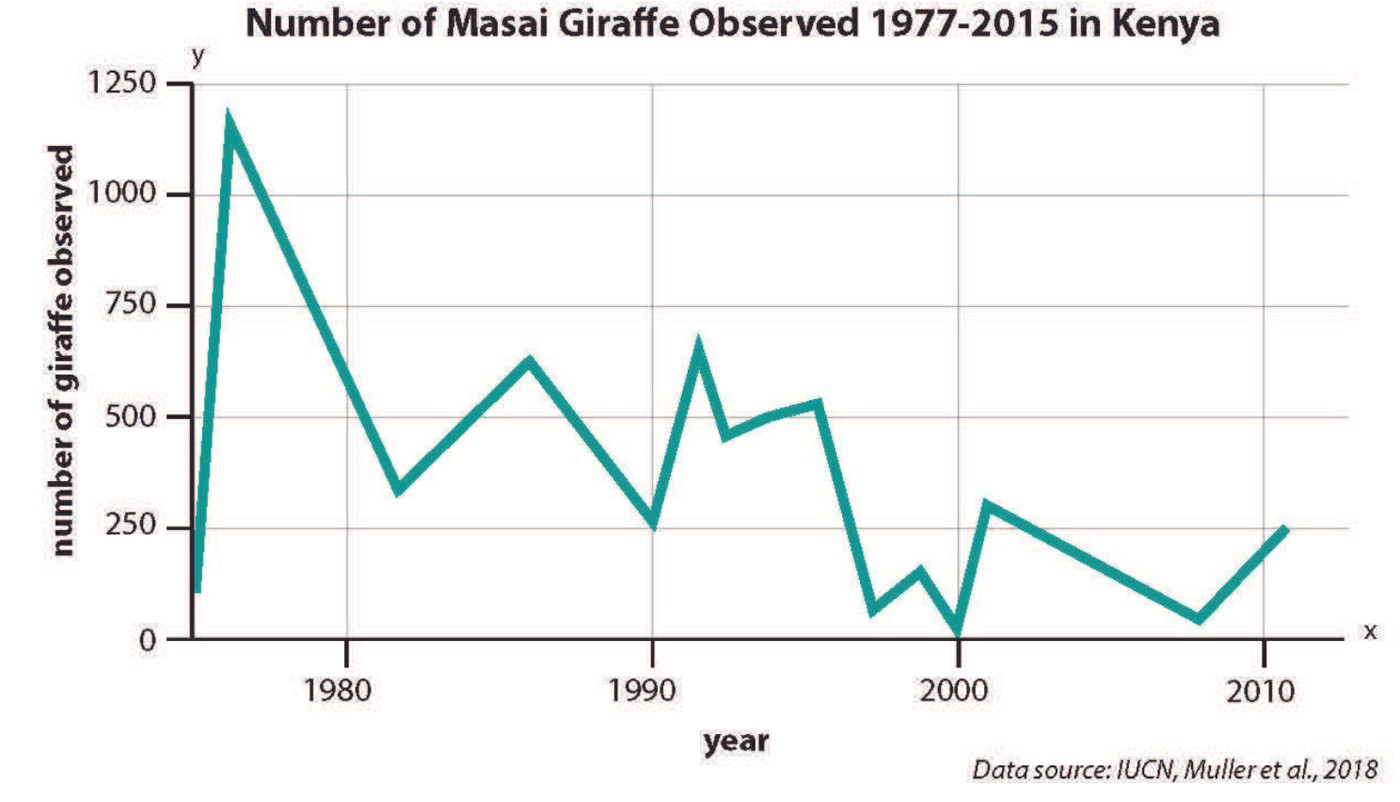
Why is a declining survey curve a starting point rather than a complete causal explanation?
Illustrative evidence case. Observed counts can reflect multiple pressures and observation changes.
Notice and wonder
Record two observations using the stated quantities or relationships. Keep observations separate from possible causes. Write one question that a new measurement could help answer.
Why is a declining survey curve a starting point rather than a complete causal explanation?
Your first model
Keep abundance, detection, geography and causal mechanisms separate.
Build the language from the idea
- biodiversity
- The variety of life in an area — the number of different species, the genetic variation within them, and the range of ecosystems they form.
- extinction
- The permanent loss of a species that occurs when its last individuals die; it cannot be reversed.
- habitat fragmentation
- The breaking apart of a large, continuous habitat into smaller, isolated patches, which cuts off populations and shrinks the space available to them.
- invasive species
- A non-native species that spreads rapidly in a new range and harms native species, often because it has no natural predators, parasites, or competitors there to keep it in check.
- ecosystem services
- The many benefits healthy, biodiverse ecosystems provide to people for free, such as pollination, clean water, fertile soil, and climate regulation.
Biodiversity includes variation within species, among species, and among ecosystems. Loss can mean fewer individuals, local disappearance, reduced genetic variation, or global extinction. These are different indicators and should be measured with appropriate evidence.
Global extinction is irreversible on practical planning timescales, while local populations sometimes recover if conditions improve. Rates are estimated from incomplete observations and depend on method and comparison period. Avoid presenting one undated numerical extinction multiplier as an exact current measurement.
Habitat conversion and fragmentation can reduce resources, isolate populations, and alter edges. The severity depends on species needs, patch size, connectivity, and surrounding land. Corridors can help some organisms but need evaluation of disease, invasive spread, and actual use.
Other pressures include overharvest, pollution, climate change, and invasive species. Non-native does not automatically mean invasive; documented establishment and harm matter. Pressures interact, and their relative importance differs among habitats and species.
Ecosystem services include food, pollination, water regulation, cultural values, and other benefits. Biodiversity can support resilience, but a service metric alone does not capture every ecological function or ethical value. Define goals before selecting a conservation indicator.
Compare habitat protection, restoration, harvest controls, invasive management, and captive breeding using target-specific evidence. A strong plan sets measurable goals, identifies stakeholders, monitors survival or recruitment and habitat condition, and adjusts when outcomes differ from predictions.
Model check: Non-native does not automatically mean invasive; harmful establishment/spread needs evidence.
Build your understanding
Use the detailed parent plan: two core 50–60-minute sessions per focused unit, with a third assigned for selected calculation/modeling topics. First study the core explanation and Parts 1–2 with their figures/checks; next study Parts 3–4, the whole-unit application, worked cases, varied practice and exit check. Attempt reasoning before opening guidance. Extend time when actual understanding requires it; investigations and chapter assessments have separate sessions.
Part 1 · Separate extinction, local loss, and abundance decline
Extinction is global loss of a species; extirpation is loss from a specified region. An abundance decline means fewer individuals in a defined population and can occur without either kind of complete loss. Strong absence claims need suitable search coverage and detection assessment. A decline graph should retain location, species, effort and uncertainty rather than being relabeled as a global census or a direct extinction count.
Read the visual model
Identify the labeled structures and units, then trace the arrows or compare values under the caption’s stated conditions. Separate the displayed evidence from a further inference. Write your reasoning before opening the guidance.
Can zero observations on one visit establish global extinction?
Visual reasoning — after your attempt
No. Sampling extent, detectability and repeated appropriate evidence are far too limited for that claim.
Global extinction means no living members remain anywhere; local disappearance and declining abundance are different outcomes. Detection limits matter: an unobserved species may still be present. State the spatial scale, taxon, survey method, and time interval before calling a loss.
A species missing from one pond can persist elsewhere. A low count can reflect reduced detectability as well as a real decline.
Pause and explain
Why does one zero survey not prove global extinction?
Check your reasoning after answering
Its geographic coverage and detection probability are limited; much broader evidence is required for a global claim.
Part 2 · Trace mechanisms of multiple pressures
Habitat loss, exploitation, pollution, invasive organisms and climate-related changes can affect populations through different mechanisms. Pressures can interact: fragmentation may restrict movement while a climate shift changes where suitable conditions occur. A non-native species is outside its historical range through introduction; invasive additionally involves spread and harmful effects under the used definition. Not every non-native species is automatically invasive, and a named pressure alone does not quantify its contribution to a decline.
Read the visual model
Identify the labeled structures and units, then trace the arrows or compare values under the caption’s stated conditions. Separate the displayed evidence from a further inference. Write your reasoning before opening the guidance.
What mechanism would connect a barrier with population persistence?
Visual reasoning — after your attempt
It can reduce movement, recolonization or gene flow; actual effects need species-specific movement and demographic evidence.
Habitat change, introduced species, harvesting, pollution, and climate pressures can affect populations through different mechanisms and can interact. A general list is not a causal explanation for a specific site. Identify how a pressure changes survival, reproduction, movement, or habitat function.
Fragmentation can restrict movement even when some habitat area remains. Species responses depend on dispersal and resource needs.
Pause and explain
What makes a threat explanation specific enough to test?
Check your reasoning after answering
It names a pressure, a population process or habitat pathway, and observations that could confirm or challenge the proposed effect.
Part 3 · Compare monitoring under matching effort
Observed abundance depends on true population, sampled extent, effort and detectability. A declining count may signal ecological loss, but an observation model is needed to separate that from reduced survey effort or changed visibility. The two hypothetical curves are reminders of this ambiguity, not proof that any particular real decline is only a measurement artifact. Preserve all source labels and compare repeated standardized monitoring or an appropriate detection-adjusted analysis.
Read the visual model
Identify the labeled structures and units, then trace the arrows or compare values under the caption’s stated conditions. Separate the displayed evidence from a further inference. Write your reasoning before opening the guidance.
What records are essential alongside a count series?
Visual reasoning — after your attempt
Survey area, method, effort, timing, observer/detection conditions and relevant uncertainty.
Changes in richness or occupancy require comparable survey coverage, timing, and detection. Effort changes can mimic a biological change. Repeat representative observations and report uncertainty, including the possibility of rare species being missed.
A longer second survey may find more species without an actual gain. Matched effort helps separate method effects from ecological change.
Pause and explain
Why might improved monitoring make apparent richness rise?
Check your reasoning after answering
The improved method can detect previously missed species, so a higher observed count need not imply new arrivals or recovery.
Part 4 · Test conservation actions against their mechanism
A conservation action should have an explicit causal hypothesis and measurable outcomes. A corridor’s construction is an output; actual movement, survival and population persistence are outcomes requiring monitoring. A before/after change can be influenced by weather or other interventions, so comparisons, baseline records and uncertainty strengthen evaluation. Include affected communities and possible unintended effects, and revise an action if the expected mechanism does not occur.
Read the visual model
Identify the labeled structures and units, then trace the arrows or compare values under the caption’s stated conditions. Separate the displayed evidence from a further inference. Write your reasoning before opening the guidance.
Why is the number of planted seedlings not enough to establish habitat recovery?
Visual reasoning — after your attempt
Survival, growth, habitat function and broader ecological outcomes still need evidence over an appropriate interval.
A corridor, restored habitat, or harvest limit should have measurable goals linked to the pressure it addresses. Evaluate baseline and comparison sites, time lags, and unintended effects. Area protected is an action measure; population response is a separate outcome.
A corridor can be mapped immediately, while evidence of successful movement and reproduction may require longer monitoring.
Pause and explain
Does a larger protected area automatically prove recovery?
Check your reasoning after answering
No. Habitat quality, connectivity, management, pressures, and measured population responses determine whether recovery follows.
Apply the whole unit · Evaluate a restoration occupancy comparison
Illustrative matched surveys: restored site occupancy rises from 8 of 20 plots to 12 of 20; comparison site rises from 10 of 20 to 11 of 20. Assume identical survey methods but no uncertainty or randomization information.
Your task
Calculate occupancy changes in percentage points and their difference. Explain why the result supports a preliminary comparison rather than proof that restoration caused population recovery.
What your response should show
- Define the system, quantities, units, and relevant conditions before selecting a model.
- Show intermediate calculations or a labeled evidence account, including signs or denominators.
- Explain how the supplied evidence supports the conclusion rather than reporting only an answer.
- Identify a meaningful uncertainty, model limit, or measurement needed to test the conclusion.
Response guidance — after your attempt
Restored occupancy: 40% to 60%, change+20 percentage points.
Comparison occupancy: 50% to 55%, change+5 percentage points.
Difference in changes=+15 percentage points.
The restored site shows the larger supplied change, but nonrandom site differences, detection, and sampling variation remain possible explanations. Occupancy is presence across plots rather than total abundance or global extinction status. Replicated comparison sites and a mechanism-linked monitoring plan would strengthen the inference.
Scientific references and source-model foundations
- OpenStax — biodiversity and conservation biology
- OpenSciEd public middle-school figure license — CC BY 4.0
Parent / teacher teaching notes
Ask students to distinguish percentage points from percentage growth and occupancy from abundance. Reward a conditional conclusion tied to the actual survey scale. Ask the learner to explain each symbol, axis, unit and arrow before calculating. Calculated examples, supplied illustrative records and actual historical observations are labeled separately. Selected public OpenSciEd middle-school source figures are foundation examples, not complete high-school editions or an endorsement; all advanced explanations are supplied locally.
The key idea
Distinguish abundance decline, local loss and global extinction. Compare standardized evidence, causal pressures and actual conservation outcomes without an undated universal extinction multiplier.
Worked examples
Example 1
- Recall the HIPPO drivers: Habitat destruction, Invasive species, Pollution, Population/overconsumption, Overexploitation.
- (a) Clearing forest for a plantation removes the natural habitat.
- (b) Catching fish faster than they reproduce is overexploitation.
- (c) A non-native species spreading and harming natives is an invasive species.
- (d) A toxin building up in wildlife is pollution.
Example 2 · Worked application
- Observed counts depend on true abundance and detection probability.
- Fragmentation is a plausible mechanism, but altered visibility or effort can affect the count.
- Use standardized repeated surveys and independent indicators.
Absence of detection is not proof of absence.
Example 3
- Total remaining area = 4 patches × 125 hectares = 500 hectares.
- Fraction remaining = 500 ÷ 2,000 = 0.25, so 25% is left and 75% has been lost.
- The remaining forest is fragmented into small, isolated patches. Populations are cut off from one another (reducing gene flow), each patch may be too small to support wide-ranging or large species, and the increased edge exposes the interior to drying, predators, and invasive species.
Example 4 · Find and fix the mistake
- Test the claim against the stated conditions: Absence of detection is not proof of absence.
- Effects depend on species, environment and interactions; invasiveness and impact require evidence.
Absence of detection is not proof of absence.
Example 5 · Reason from the visual model
- Observed abundance depends on true population, sampled extent, effort and detectability. A declining count may signal ecological loss, but an observation model is needed to separate that from reduced survey effort or changed visibility. The two hypothetical curves are reminders of this ambiguity, not proof that any particular real decline is only a measurement artifact. Preserve all source labels and compare repeated standardized monitoring or an appropriate detection-adjusted analysis.
- Survey area, method, effort, timing, observer/detection conditions and relevant uncertainty.
Synthetic count examples with deliberately different possible observation processes; not a correction to an actual field record.
Avoid these mistakes
- Non-native does not automatically mean invasive; harmful establishment/spread needs evidence.
Check your understanding
Why can habitat corridors help but need case-specific evaluation?
Discuss the answer
They can improve movement and gene flow but also transport disease or invasives; compare evidence and target species.
Return to the phenomenon
Return to the initial case. Why is a declining survey curve a starting point rather than a complete causal explanation? Revise your drawing or explanation using two named ideas and one stated limitation.
Compare explanations after your attempt
Use standardized records and independent mechanism evidence; evaluate conservation by outcomes rather than only completed activities.
What should we investigate next?
Which comparison would test a remaining uncertainty? State what you would change, keep comparable and measure.
Investigate, calculate and revise
Keep a first model and an evidence-supported revision. Attempt each task before opening guidance; all required explanations and supplied-data routes are available locally.
Activity 1 · Return to the opening case
Use the opening phenomenon, unit definitions and explained Parts 1–4.
Your task
Return to the initial case. Why is a declining survey curve a starting point rather than a complete causal explanation? Revise your drawing or explanation using two named ideas and one stated limitation.
Success criteria
- Use the stated observations and appropriate units.
- Connect a labeled model with the physical/environmental mechanism.
- State assumptions and an evidence limitation.
- Explain a substantive revision or next test.
Hint
Keep object/material identity, material transfer and energy account distinct.
Response guidance — discuss after your attempt
Use standardized records and independent mechanism evidence; evaluate conservation by outcomes rather than only completed activities.
Activity 2 · Transfer to a changed case
Cover the worked answer and use the explained models, relationships and notebook.
Your task
A population estimate falls from 500 to 350 under comparable methods. Find percent decline. Explain why this does not prove global extinction or identify a unique cause.
Success criteria
- Use the stated measurements or conditions, with correct units.
- Connect the result to the physical or environmental mechanism or evidence relationship.
- Identify the assumption, model limit or further evidence requested.
Hint
Name known quantities and conditions, show intermediate steps and check conservation.
Response guidance — discuss after your attempt
Decline=(500−350)/500=30%. Living individuals remain in the defined population, and the record alone cannot distinguish survival, reproduction, movement or the pressures affecting them.
Words to know
- biodiversity
- The variety of life in an area — the number of different species, the genetic variation within them, and the range of ecosystems they form.
- extinction
- The permanent loss of a species that occurs when its last individuals die; it cannot be reversed.
- habitat fragmentation
- The breaking apart of a large, continuous habitat into smaller, isolated patches, which cuts off populations and shrinks the space available to them.
- invasive species
- A non-native species that spreads rapidly in a new range and harms native species, often because it has no natural predators, parasites, or competitors there to keep it in check.
- ecosystem services
- The many benefits healthy, biodiverse ecosystems provide to people for free, such as pollination, clean water, fertile soil, and climate regulation.
The Big Five — and why some call ours the Sixth
Life has been nearly wiped out five times before, in events scientists call the Big Five mass extinctions. The worst, at the end of the Permian period about 250 million years ago, killed off an estimated 90% of marine species; the most famous, 66 million years ago, ended the age of the dinosaurs when an asteroid struck. Each earlier extinction was driven by natural forces like volcanism or impacts. Many biologists argue we have now entered a sixth mass extinction — the first ever caused by a single living species, and the first that another species could, in principle, choose to stop.
Not every non-native species is 'invasive'
It is a common misconception that any introduced species is automatically harmful. In fact, the great majority of species moved to new places — including most of our crops and garden plants — never spread out of control, and many fail to survive at all. A species only earns the label invasive when it both establishes itself and causes ecological or economic harm, usually because the new environment lacks the predators, diseases, or competitors that kept it in check back home. Understanding that distinction helps focus limited conservation effort on the small fraction of introductions that genuinely threaten native ecosystems.
Keystone species and trophic cascades
Some species hold their ecosystems together far out of proportion to their numbers — ecologists call them keystone species. Sea otters are the classic case: by eating sea urchins, they protect the kelp forests that urchins would otherwise devour, so losing the otters can collapse an entire underwater ecosystem in a chain reaction called a trophic cascade. The reintroduction of wolves to Yellowstone is often told the same way, with the returning predator reshaping elk behavior and letting streamside vegetation recover. These stories show why losing even one well-connected species can ripple across a whole web of life.
From billions to zero — and back from twenty-seven
Two North American birds bookend what humans can do to biodiversity. The passenger pigeon was once the most abundant bird on the continent, flying in flocks of billions that darkened the sky — yet relentless overhunting and habitat loss drove it to extinction, and the last individual, Martha, died in a zoo in 1914. The California condor nearly followed: by 1987 just 27 birds remained, so biologists captured every one for a captive-breeding program. It worked, and today hundreds of condors again fly wild — proof that determined conservation can pull a species back from the very edge, even if extinction itself can never be undone.
Nature's pharmacy: why a lost species may be a lost cure
A striking share of modern medicines were first discovered in wild organisms, so biodiversity loss can mean losing cures we never found. The cancer drug paclitaxel came from the bark of the Pacific yew tree; the rosy periwinkle, a small plant from Madagascar, yielded compounds that dramatically improved survival for childhood leukemia and Hodgkin's disease; and countless antibiotics trace back to soil microbes. Scientists call the search for such natural compounds bioprospecting. Every species driven extinct closes a chapter of this library before we have even read it — a powerful, self-interested argument for protecting biodiversity.
In the real world
Roughly one out of every three bites of food you eat depends on animal pollinators like bees — so the worldwide decline of pollinators isn't only a wildlife problem, it's a direct threat to the global food supply.
Exit check
Why can habitat corridors help but need case-specific evaluation?
Check your explanation after answering
They can improve movement and gene flow but also transport disease or invasives; compare evidence and target species.
Explain your reasoning without notes. If a key idea is missing, revisit the lesson and try again.