Conservation, Systems & Environmental Design — Chapter Practice, Grade 12
Join conservation evidence, feedback, risk, and a complete design-and-monitoring proposal.
Problem 1
- Scientists collecting a few specimens for study
- Natural predators hunting their usual prey
- Zoos keeping some animals in captivity
- Habitat loss and fragmentation from clearing and dividing land
Answer and explanation
Habitat loss and fragmentation from clearing and dividing land
Clearing and dividing land can reduce available habitat and connectivity. The relative importance of threats varies among ecosystems and requires evidence.
Problem 2
- a non-native species that spreads rapidly in a new area and harms native species
- any large predator at the top of a food chain
- a native species that has lived in an ecosystem for thousands of years
- any species that is currently close to extinction
Answer and explanation
a non-native species that spreads rapidly in a new area and harms native species
Invasive species are non-natives that, lacking natural predators or competitors in the new range, spread out of control and damage native populations.
Problem 3
Answer and explanation
85 %
Area lost = 500 - 75 = 425 hectares; 425 ÷ 500 = 0.85, or 85% of the wetland lost.
Problem 4
Answer and explanation
Examples include pollination of crops by insects, filtering and cleaning of water by wetlands and forests, fertile soil built by soil organisms, flood control, and climate regulation. These services depend on many interacting species; as biodiversity declines, the organisms that perform them are lost and the services weaken or fail, directly harming the food, water, and protection people rely on.
Problem 5
- Because a higher extinction rate must mean the number of species is increasing
- Because extinctions at this pace outrun the rate at which evolution produces new species, so total biodiversity is falling and lost species can never be recovered
- Because faster extinction means new species also appear faster, keeping biodiversity constant
- Because extinction has never happened before in Earth's history
Answer and explanation
Because extinctions at this pace outrun the rate at which evolution produces new species, so total biodiversity is falling and lost species can never be recovered
Extinction is permanent, and losing species far faster than new ones evolve means biodiversity is steadily and irreversibly declining.
Problem 6
Hints
Absence of detection is not proof of absence.
Answer and explanation
It can restrict movement, gene flow and access to resources and increase edge effects.
Problem 7
Hints
State what the supplied observations or conditions establish, and separate that from any assumption.
Answer and explanation
Comparable abundance, reproduction, habitat or functional measures with methods, baseline and uncertainty disclosed.
Problem 8
Answer and explanation
Survey area, method, effort, timing, observer/detection conditions and relevant uncertainty.
Observed abundance depends on true population, sampled extent, effort and detectability. A declining count may signal ecological loss, but an observation model is needed to separate that from reduced survey effort or changed visibility. The two hypothetical curves are reminders of this ambiguity, not proof that any particular real decline is only a measurement artifact. Preserve all source labels and compare repeated standardized monitoring or an appropriate detection-adjusted analysis.
Survey area, method, effort, timing, observer/detection conditions and relevant uncertainty.
Response criteria
- Interpret labels, structures, axes, units and directions correctly.
- Explain the physical or environmental relationship or mechanism.
- Respect stated assumptions and distinguish observation from inference.
Problem 9
Answer and explanation
Decline=(500−350)/500=30%. Living individuals remain in the defined population, and the record alone cannot distinguish survival, reproduction, movement or the pressures affecting them.
Decline=(500−350)/500=30%.
Living individuals remain in the defined population, and the record alone cannot distinguish survival, reproduction, movement or the pressures affecting them.
Response criteria
- Use the stated measurements or conditions, with correct units.
- Connect the result to the physical or environmental mechanism or evidence relationship.
- Identify the assumption, model limit or further evidence requested.
Problem 10
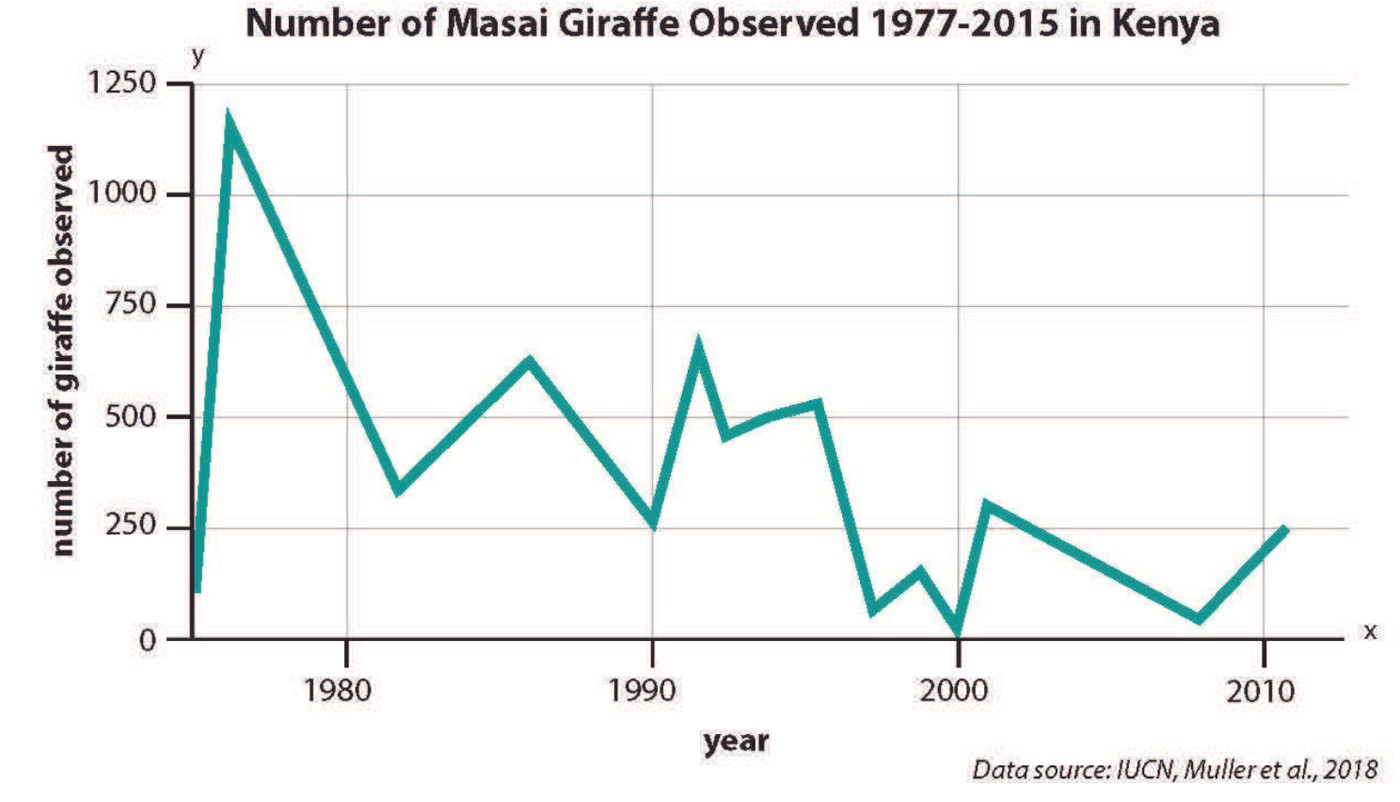
Answer and explanation
The displayed observed counts fluctuate, with an early high peak and many lower later counts. It is a Kenya-scoped observed-count graph, not a global census. Search effort, coverage, detection and demographic/pressure evidence are needed to interpret actual abundance and causes. The title’s interval must not be used to fabricate unplotted exact annual values.
Read source labels, scope, axes and intentional omissions.
Use the complete local explanation to draw a justified mechanism or calculate a supported quantity.
State what is observed, what is assumed and what evidence remains needed.
Response criteria
- Interpret the source labels, units and scope accurately.
- Explain the relevant mechanism with a labeled model or supported calculation.
- Identify a meaningful assumption, uncertainty or missing comparison.
Problem 11
- Protecting one endangered species while ignoring its habitat
- Using up resources as quickly as possible to grow the economy today
- Meeting the needs of the present without compromising the ability of future generations to meet their own needs
- Returning human society to a time before any technology existed
Answer and explanation
Meeting the needs of the present without compromising the ability of future generations to meet their own needs
Sustainability balances present needs against the future, ensuring that using resources today does not rob later generations of the ability to meet their own needs.
Problem 12
- Coal
- Natural gas
- Oil
- Wind
Answer and explanation
Wind
Wind is naturally and continuously replenished; coal, natural gas, and oil are finite fossil fuels that release carbon when burned.
Problem 13
Answer and explanation
2.5 Earths
Earths needed = footprint ÷ biocapacity = 4.0 ÷ 1.6 = 2.5 Earths.
Problem 14
Answer and explanation
An individual action is a personal choice with a small direct effect but which, multiplied across many people and shifting norms, still matters. A systemic solution changes the rules, infrastructure, or technology for everyone at once — like replacing fossil-fuel power plants with renewables — so it has far greater leverage over the largest sources of impact. Both are useful: individual actions build support and habits, while systemic changes deliver the large-scale reductions that individual choices alone cannot.
Problem 15
- It shows that coordinated international policy, guided by science, can reduce a global pollutant and let an Earth system begin to recover
- It shows that ignoring an environmental problem is the safest strategy
- It shows that global pollution problems solve themselves without any action
- It proves that individual recycling alone can fix any global problem
Answer and explanation
It shows that coordinated international policy, guided by science, can reduce a global pollutant and let an Earth system begin to recover
Nearly every nation agreed to phase out CFCs, and the ozone layer is now healing — evidence that science-guided global cooperation can solve a planet-scale environmental problem.
Problem 16
Hints
Equivalent transport service and lifetime matter.
Answer and explanation
8 years.
Problem 17
Hints
State what the supplied observations or conditions establish, and separate that from any assumption.
Answer and explanation
A solution must deliver the intended service feasibly and equitably; a single environmental metric does not describe all design criteria.
Problem 18
Answer and explanation
B, with score 4 versus A’s2. The ranking depends on the stated priority.
A decision matrix records alternatives, criteria, scores and any weights. Scores should use a defined scale and evidence basis; weights express priorities and sum consistently. Here A scores 3.6 and B3.1 with the displayed illustrative weights. That result is conditional, not proof that A is objectively best for every family or community. Test different justified weights and uncertain scores, especially where affected groups have different constraints.
B, with score 4 versus A’s2. The ranking depends on the stated priority.
Response criteria
- Interpret labels, structures, axes, units and directions correctly.
- Explain the physical or environmental relationship or mechanism.
- Respect stated assumptions and distinguish observation from inference.
Problem 19
Answer and explanation
Old=1000 units; new=840; saving=160 units=16%, smaller than the 40% per-use reduction. Adequate service quality, access or reliability needs a separate measure.
Old=1000 units; new=840; saving=160 units=16%, smaller than the 40% per-use reduction.
Adequate service quality, access or reliability needs a separate measure.
Response criteria
- Use the stated measurements or conditions, with correct units.
- Connect the result to the physical or environmental mechanism or evidence relationship.
- Identify the assumption, model limit or further evidence requested.
Problem 20
Hints
Write the relationship first; substitute with consistent units.
Answer and explanation
20 years
600/30=20.
Problem 21
Answer and explanation
No; positive means amplifying, not good.
Response criteria
- State a scientifically accurate conclusion.
- Show the calculation or mechanism that supports it.
- Include units, conditions, or limits where relevant.
Problem 22
Hints
List the given quantities, select a relationship, and check units before substituting.
Answer and explanation
125 units
100+45−20=125.
Problem 23
Answer and explanation
They may differ in extreme outcomes, who is exposed, reversibility, and uncertainty.
Response criteria
- State a scientifically accurate conclusion.
- Show the calculation or mechanism that supports it.
- Include units, conditions, or limits where relevant.
Problem 24
Hints
Negative does not mean undesirable.
Answer and explanation
A reinforcing depletion loop if the lower levels worsen shortage and induce more pumping.
Problem 25
Hints
State what the supplied observations or conditions establish, and separate that from any assumption.
Answer and explanation
Rare severe events and frequent minor events differ; neither likelihood nor severity alone describes risk adequately.
Problem 26
Answer and explanation
A has expected 10 versus 7.5 for B, and its consequence 100 is also larger; other scenarios could separate those rankings.
A simple expected loss multiplies event probability by a consequence on a defined comparable scale, summing across mutually specified outcomes. Probability needs an interval and reference class. Exposure concerns who or what is in contact with the hazard; vulnerability affects the damage given that contact. Two options can have similar expected loss but different worst cases, inequality or uncertainty. Explain these dimensions rather than treating one average as the entire decision.
A has expected 10 versus 7.5 for B, and its consequence 100 is also larger; other scenarios could separate those rankings.
Response criteria
- Interpret labels, structures, axes, units and directions correctly.
- Explain the physical or environmental relationship or mechanism.
- Respect stated assumptions and distinguish observation from inference.
Problem 27
Answer and explanation
A=10 units; B=8 units. B has lower expected loss, but worst-case severity, uncertainty, distribution, constraints and priorities still need transparent consideration.
A=10 units; B=8 units.
B has lower expected loss, but worst-case severity, uncertainty, distribution, constraints and priorities still need transparent consideration.
Response criteria
- Use the stated measurements or conditions, with correct units.
- Connect the result to the physical or environmental mechanism or evidence relationship.
- Identify the assumption, model limit or further evidence requested.
Problem 28
Hints
Write the relationship first; substitute with consistent units.
Answer and explanation
30 kWh/year
.020×1500=30.
Problem 29
Answer and explanation
It makes change and added benefit measurable rather than assuming every new option is better.
Response criteria
- State a scientifically accurate conclusion.
- Show the calculation or mechanism that supports it.
- Include units, conditions, or limits where relevant.
Problem 30
Hints
List the given quantities, select a relationship, and check units before substituting.
Answer and explanation
5 years
500/100=5, excluding other costs.
Problem 31
Hints
Write the relationship first; substitute with consistent units.
Answer and explanation
3 years
900/300=3.
Problem 32
Hints
Use provided datasets for analysis; do not consume experimental treated water.
Answer and explanation
10×(1−0.40)=6 mg/L; this calculation alone does not establish safety.
Problem 33
Hints
State what the supplied observations or conditions establish, and separate that from any assumption.
Answer and explanation
Problem, criteria, mechanism, alternatives, methods, data, uncertainty, trade-offs, limitations and a monitoring/revision plan tied to measurable outcomes.
Problem 34
Answer and explanation
Its 40-unit extra up-front burden exceeds its 30-unit one-year saving, before replacement impacts and other criteria are considered.
An alternatives analysis compares multiple feasible designs under the same service definition. Here B uses 30 fewer energy units per year but has 40 additional up-front units, giving an energy break-even around 1.33 years if conditions persist. Lifespan, maintenance and service quality can change that conclusion. Examine a plausible range and identify what would reverse the ranking; report non-energy criteria alongside the selected account rather than hiding them inside one unsupported score.
Its 40-unit extra up-front burden exceeds its 30-unit one-year saving, before replacement impacts and other criteria are considered.
Response criteria
- Interpret labels, structures, axes, units and directions correctly.
- Explain the physical or environmental relationship or mechanism.
- Respect stated assumptions and distinguish observation from inference.
Problem 35
Answer and explanation
Annual saving=0.012×1500=18 kWh. Energy break-even=24/18≈1.33 years under fixed use/lifespan assumptions. Measure service adequacy, reliability, actual hours, access or maintenance as a separate pilot outcome.
Annual saving=0.012×1500=18 kWh.
Energy break-even=24/18≈1.33 years under fixed use/lifespan assumptions.
Measure service adequacy, reliability, actual hours, access or maintenance as a separate pilot outcome.
Response criteria
- Use the stated measurements or conditions, with correct units.
- Connect the result to the physical or environmental mechanism or evidence relationship.
- Identify the assumption, model limit or further evidence requested.