Conservation, Systems & Environmental Design — Print · Physics & Environmental Science, Grade 12
Join conservation evidence, feedback, risk, and a complete design-and-monitoring proposal.
Printable chapter lessons and review.
Biodiversity Loss
Learning goals
- I can define biodiversity and explain why it matters to ecosystems and to people.
- I can identify the major human-caused drivers of biodiversity loss.
- I can explain why the current rate of extinction concerns scientists.
Readings for this unit
Before this unit
Habitat, population, diversity, and fragmentation.
Use the detailed parent plan: two core 50–60-minute sessions per focused unit, with a third assigned for selected calculation/modeling topics. First study the core explanation and Parts 1–2 with their figures/checks; next study Parts 3–4, the whole-unit application, worked cases, varied practice and exit check. Attempt reasoning before opening guidance. Extend time when actual understanding requires it; investigations and chapter assessments have separate sessions.
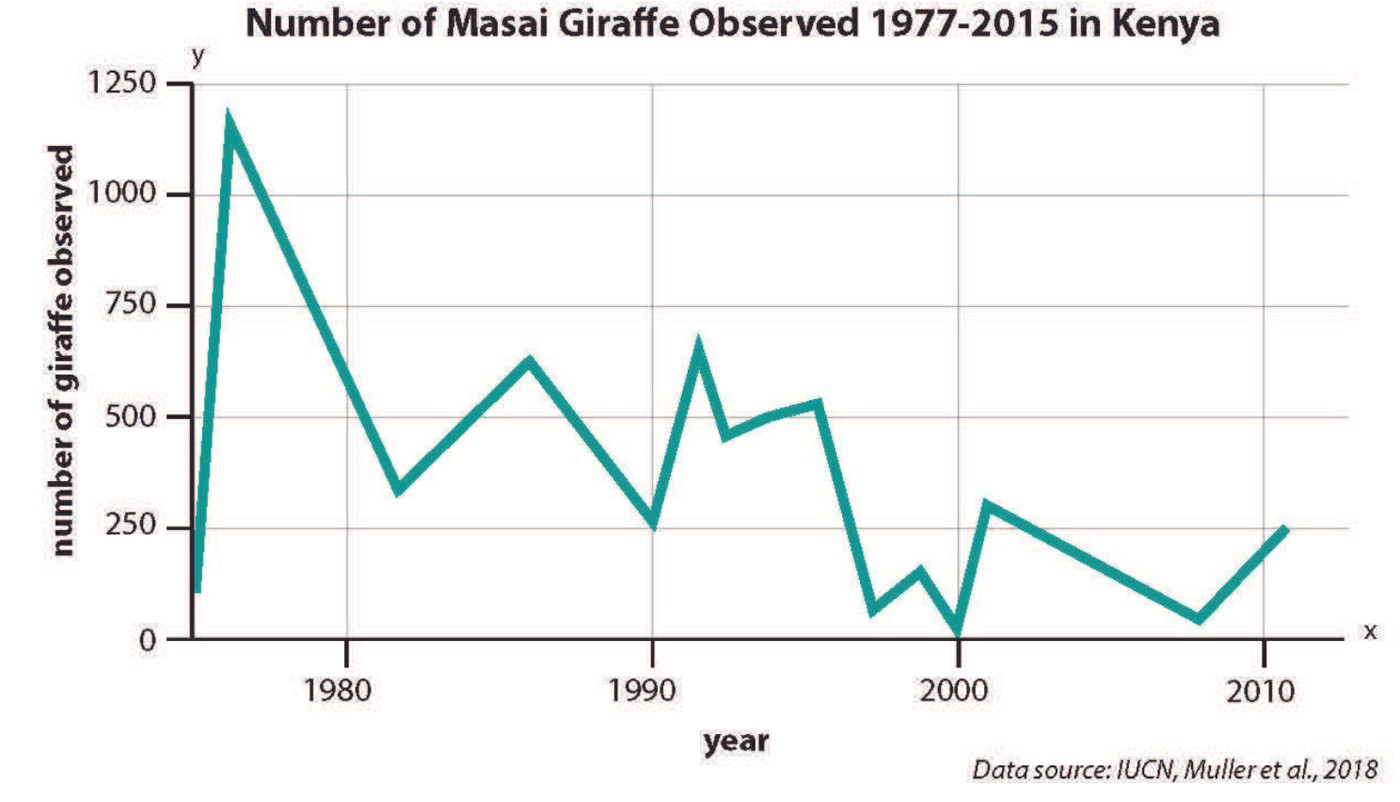
Start with something to explain
Why is a declining survey curve a starting point rather than a complete causal explanation?
Illustrative evidence case. Observed counts can reflect multiple pressures and observation changes.
Notice and wonder
Record two observations using the stated quantities or relationships. Keep observations separate from possible causes. Write one question that a new measurement could help answer.
Why is a declining survey curve a starting point rather than a complete causal explanation?
Your first model
Keep abundance, detection, geography and causal mechanisms separate.
Build the language from the idea
- biodiversity
- The variety of life in an area — the number of different species, the genetic variation within them, and the range of ecosystems they form.
- extinction
- The permanent loss of a species that occurs when its last individuals die; it cannot be reversed.
- habitat fragmentation
- The breaking apart of a large, continuous habitat into smaller, isolated patches, which cuts off populations and shrinks the space available to them.
- invasive species
- A non-native species that spreads rapidly in a new range and harms native species, often because it has no natural predators, parasites, or competitors there to keep it in check.
- ecosystem services
- The many benefits healthy, biodiverse ecosystems provide to people for free, such as pollination, clean water, fertile soil, and climate regulation.
Biodiversity includes variation within species, among species, and among ecosystems. Loss can mean fewer individuals, local disappearance, reduced genetic variation, or global extinction. These are different indicators and should be measured with appropriate evidence.
Global extinction is irreversible on practical planning timescales, while local populations sometimes recover if conditions improve. Rates are estimated from incomplete observations and depend on method and comparison period. Avoid presenting one undated numerical extinction multiplier as an exact current measurement.
Habitat conversion and fragmentation can reduce resources, isolate populations, and alter edges. The severity depends on species needs, patch size, connectivity, and surrounding land. Corridors can help some organisms but need evaluation of disease, invasive spread, and actual use.
Other pressures include overharvest, pollution, climate change, and invasive species. Non-native does not automatically mean invasive; documented establishment and harm matter. Pressures interact, and their relative importance differs among habitats and species.
Ecosystem services include food, pollination, water regulation, cultural values, and other benefits. Biodiversity can support resilience, but a service metric alone does not capture every ecological function or ethical value. Define goals before selecting a conservation indicator.
Compare habitat protection, restoration, harvest controls, invasive management, and captive breeding using target-specific evidence. A strong plan sets measurable goals, identifies stakeholders, monitors survival or recruitment and habitat condition, and adjusts when outcomes differ from predictions.
Model check: Non-native does not automatically mean invasive; harmful establishment/spread needs evidence.
Build your understanding
Use the detailed parent plan: two core 50–60-minute sessions per focused unit, with a third assigned for selected calculation/modeling topics. First study the core explanation and Parts 1–2 with their figures/checks; next study Parts 3–4, the whole-unit application, worked cases, varied practice and exit check. Attempt reasoning before opening guidance. Extend time when actual understanding requires it; investigations and chapter assessments have separate sessions.
Part 1 · Separate extinction, local loss, and abundance decline
Extinction is global loss of a species; extirpation is loss from a specified region. An abundance decline means fewer individuals in a defined population and can occur without either kind of complete loss. Strong absence claims need suitable search coverage and detection assessment. A decline graph should retain location, species, effort and uncertainty rather than being relabeled as a global census or a direct extinction count.
Read the visual model
Identify the labeled structures and units, then trace the arrows or compare values under the caption’s stated conditions. Separate the displayed evidence from a further inference. Write your reasoning before opening the guidance.
Can zero observations on one visit establish global extinction?
Visual reasoning — after your attempt
No. Sampling extent, detectability and repeated appropriate evidence are far too limited for that claim.
Global extinction means no living members remain anywhere; local disappearance and declining abundance are different outcomes. Detection limits matter: an unobserved species may still be present. State the spatial scale, taxon, survey method, and time interval before calling a loss.
A species missing from one pond can persist elsewhere. A low count can reflect reduced detectability as well as a real decline.
Pause and explain
Why does one zero survey not prove global extinction?
Check your reasoning after answering
Its geographic coverage and detection probability are limited; much broader evidence is required for a global claim.
Part 2 · Trace mechanisms of multiple pressures
Habitat loss, exploitation, pollution, invasive organisms and climate-related changes can affect populations through different mechanisms. Pressures can interact: fragmentation may restrict movement while a climate shift changes where suitable conditions occur. A non-native species is outside its historical range through introduction; invasive additionally involves spread and harmful effects under the used definition. Not every non-native species is automatically invasive, and a named pressure alone does not quantify its contribution to a decline.
Read the visual model
Identify the labeled structures and units, then trace the arrows or compare values under the caption’s stated conditions. Separate the displayed evidence from a further inference. Write your reasoning before opening the guidance.
What mechanism would connect a barrier with population persistence?
Visual reasoning — after your attempt
It can reduce movement, recolonization or gene flow; actual effects need species-specific movement and demographic evidence.
Habitat change, introduced species, harvesting, pollution, and climate pressures can affect populations through different mechanisms and can interact. A general list is not a causal explanation for a specific site. Identify how a pressure changes survival, reproduction, movement, or habitat function.
Fragmentation can restrict movement even when some habitat area remains. Species responses depend on dispersal and resource needs.
Pause and explain
What makes a threat explanation specific enough to test?
Check your reasoning after answering
It names a pressure, a population process or habitat pathway, and observations that could confirm or challenge the proposed effect.
Part 3 · Compare monitoring under matching effort
Observed abundance depends on true population, sampled extent, effort and detectability. A declining count may signal ecological loss, but an observation model is needed to separate that from reduced survey effort or changed visibility. The two hypothetical curves are reminders of this ambiguity, not proof that any particular real decline is only a measurement artifact. Preserve all source labels and compare repeated standardized monitoring or an appropriate detection-adjusted analysis.
Read the visual model
Identify the labeled structures and units, then trace the arrows or compare values under the caption’s stated conditions. Separate the displayed evidence from a further inference. Write your reasoning before opening the guidance.
What records are essential alongside a count series?
Visual reasoning — after your attempt
Survey area, method, effort, timing, observer/detection conditions and relevant uncertainty.
Changes in richness or occupancy require comparable survey coverage, timing, and detection. Effort changes can mimic a biological change. Repeat representative observations and report uncertainty, including the possibility of rare species being missed.
A longer second survey may find more species without an actual gain. Matched effort helps separate method effects from ecological change.
Pause and explain
Why might improved monitoring make apparent richness rise?
Check your reasoning after answering
The improved method can detect previously missed species, so a higher observed count need not imply new arrivals or recovery.
Part 4 · Test conservation actions against their mechanism
A conservation action should have an explicit causal hypothesis and measurable outcomes. A corridor’s construction is an output; actual movement, survival and population persistence are outcomes requiring monitoring. A before/after change can be influenced by weather or other interventions, so comparisons, baseline records and uncertainty strengthen evaluation. Include affected communities and possible unintended effects, and revise an action if the expected mechanism does not occur.
Read the visual model
Identify the labeled structures and units, then trace the arrows or compare values under the caption’s stated conditions. Separate the displayed evidence from a further inference. Write your reasoning before opening the guidance.
Why is the number of planted seedlings not enough to establish habitat recovery?
Visual reasoning — after your attempt
Survival, growth, habitat function and broader ecological outcomes still need evidence over an appropriate interval.
A corridor, restored habitat, or harvest limit should have measurable goals linked to the pressure it addresses. Evaluate baseline and comparison sites, time lags, and unintended effects. Area protected is an action measure; population response is a separate outcome.
A corridor can be mapped immediately, while evidence of successful movement and reproduction may require longer monitoring.
Pause and explain
Does a larger protected area automatically prove recovery?
Check your reasoning after answering
No. Habitat quality, connectivity, management, pressures, and measured population responses determine whether recovery follows.
Apply the whole unit · Evaluate a restoration occupancy comparison
Illustrative matched surveys: restored site occupancy rises from 8 of 20 plots to 12 of 20; comparison site rises from 10 of 20 to 11 of 20. Assume identical survey methods but no uncertainty or randomization information.
Your task
Calculate occupancy changes in percentage points and their difference. Explain why the result supports a preliminary comparison rather than proof that restoration caused population recovery.
What your response should show
- Define the system, quantities, units, and relevant conditions before selecting a model.
- Show intermediate calculations or a labeled evidence account, including signs or denominators.
- Explain how the supplied evidence supports the conclusion rather than reporting only an answer.
- Identify a meaningful uncertainty, model limit, or measurement needed to test the conclusion.
Response guidance — after your attempt
Restored occupancy: 40% to 60%, change+20 percentage points.
Comparison occupancy: 50% to 55%, change+5 percentage points.
Difference in changes=+15 percentage points.
The restored site shows the larger supplied change, but nonrandom site differences, detection, and sampling variation remain possible explanations. Occupancy is presence across plots rather than total abundance or global extinction status. Replicated comparison sites and a mechanism-linked monitoring plan would strengthen the inference.
Scientific references and source-model foundations
- OpenStax — biodiversity and conservation biology
- OpenSciEd public middle-school figure license — CC BY 4.0
Parent / teacher teaching notes
Ask students to distinguish percentage points from percentage growth and occupancy from abundance. Reward a conditional conclusion tied to the actual survey scale. Ask the learner to explain each symbol, axis, unit and arrow before calculating. Calculated examples, supplied illustrative records and actual historical observations are labeled separately. Selected public OpenSciEd middle-school source figures are foundation examples, not complete high-school editions or an endorsement; all advanced explanations are supplied locally.
The key idea
Distinguish abundance decline, local loss and global extinction. Compare standardized evidence, causal pressures and actual conservation outcomes without an undated universal extinction multiplier.
Worked examples
Example 1
- Recall the HIPPO drivers: Habitat destruction, Invasive species, Pollution, Population/overconsumption, Overexploitation.
- (a) Clearing forest for a plantation removes the natural habitat.
- (b) Catching fish faster than they reproduce is overexploitation.
- (c) A non-native species spreading and harming natives is an invasive species.
- (d) A toxin building up in wildlife is pollution.
Example 2 · Worked application
- Observed counts depend on true abundance and detection probability.
- Fragmentation is a plausible mechanism, but altered visibility or effort can affect the count.
- Use standardized repeated surveys and independent indicators.
Absence of detection is not proof of absence.
Example 3
- Total remaining area = 4 patches × 125 hectares = 500 hectares.
- Fraction remaining = 500 ÷ 2,000 = 0.25, so 25% is left and 75% has been lost.
- The remaining forest is fragmented into small, isolated patches. Populations are cut off from one another (reducing gene flow), each patch may be too small to support wide-ranging or large species, and the increased edge exposes the interior to drying, predators, and invasive species.
Example 4 · Find and fix the mistake
- Test the claim against the stated conditions: Absence of detection is not proof of absence.
- Effects depend on species, environment and interactions; invasiveness and impact require evidence.
Absence of detection is not proof of absence.
Example 5 · Reason from the visual model
- Observed abundance depends on true population, sampled extent, effort and detectability. A declining count may signal ecological loss, but an observation model is needed to separate that from reduced survey effort or changed visibility. The two hypothetical curves are reminders of this ambiguity, not proof that any particular real decline is only a measurement artifact. Preserve all source labels and compare repeated standardized monitoring or an appropriate detection-adjusted analysis.
- Survey area, method, effort, timing, observer/detection conditions and relevant uncertainty.
Synthetic count examples with deliberately different possible observation processes; not a correction to an actual field record.
Avoid these mistakes
- Non-native does not automatically mean invasive; harmful establishment/spread needs evidence.
Check your understanding
Why can habitat corridors help but need case-specific evaluation?
Discuss the answer
They can improve movement and gene flow but also transport disease or invasives; compare evidence and target species.
Return to the phenomenon
Return to the initial case. Why is a declining survey curve a starting point rather than a complete causal explanation? Revise your drawing or explanation using two named ideas and one stated limitation.
Compare explanations after your attempt
Use standardized records and independent mechanism evidence; evaluate conservation by outcomes rather than only completed activities.
What should we investigate next?
Which comparison would test a remaining uncertainty? State what you would change, keep comparable and measure.
Investigate, calculate and revise
Keep a first model and an evidence-supported revision. Attempt each task before opening guidance; all required explanations and supplied-data routes are available locally.
Activity 1 · Return to the opening case
Use the opening phenomenon, unit definitions and explained Parts 1–4.
Your task
Return to the initial case. Why is a declining survey curve a starting point rather than a complete causal explanation? Revise your drawing or explanation using two named ideas and one stated limitation.
Success criteria
- Use the stated observations and appropriate units.
- Connect a labeled model with the physical/environmental mechanism.
- State assumptions and an evidence limitation.
- Explain a substantive revision or next test.
Hint
Keep object/material identity, material transfer and energy account distinct.
Response guidance — discuss after your attempt
Use standardized records and independent mechanism evidence; evaluate conservation by outcomes rather than only completed activities.
Activity 2 · Transfer to a changed case
Cover the worked answer and use the explained models, relationships and notebook.
Your task
A population estimate falls from 500 to 350 under comparable methods. Find percent decline. Explain why this does not prove global extinction or identify a unique cause.
Success criteria
- Use the stated measurements or conditions, with correct units.
- Connect the result to the physical or environmental mechanism or evidence relationship.
- Identify the assumption, model limit or further evidence requested.
Hint
Name known quantities and conditions, show intermediate steps and check conservation.
Response guidance — discuss after your attempt
Decline=(500−350)/500=30%. Living individuals remain in the defined population, and the record alone cannot distinguish survival, reproduction, movement or the pressures affecting them.
Words to know
- biodiversity
- The variety of life in an area — the number of different species, the genetic variation within them, and the range of ecosystems they form.
- extinction
- The permanent loss of a species that occurs when its last individuals die; it cannot be reversed.
- habitat fragmentation
- The breaking apart of a large, continuous habitat into smaller, isolated patches, which cuts off populations and shrinks the space available to them.
- invasive species
- A non-native species that spreads rapidly in a new range and harms native species, often because it has no natural predators, parasites, or competitors there to keep it in check.
- ecosystem services
- The many benefits healthy, biodiverse ecosystems provide to people for free, such as pollination, clean water, fertile soil, and climate regulation.
The Big Five — and why some call ours the Sixth
Life has been nearly wiped out five times before, in events scientists call the Big Five mass extinctions. The worst, at the end of the Permian period about 250 million years ago, killed off an estimated 90% of marine species; the most famous, 66 million years ago, ended the age of the dinosaurs when an asteroid struck. Each earlier extinction was driven by natural forces like volcanism or impacts. Many biologists argue we have now entered a sixth mass extinction — the first ever caused by a single living species, and the first that another species could, in principle, choose to stop.
Not every non-native species is 'invasive'
It is a common misconception that any introduced species is automatically harmful. In fact, the great majority of species moved to new places — including most of our crops and garden plants — never spread out of control, and many fail to survive at all. A species only earns the label invasive when it both establishes itself and causes ecological or economic harm, usually because the new environment lacks the predators, diseases, or competitors that kept it in check back home. Understanding that distinction helps focus limited conservation effort on the small fraction of introductions that genuinely threaten native ecosystems.
Keystone species and trophic cascades
Some species hold their ecosystems together far out of proportion to their numbers — ecologists call them keystone species. Sea otters are the classic case: by eating sea urchins, they protect the kelp forests that urchins would otherwise devour, so losing the otters can collapse an entire underwater ecosystem in a chain reaction called a trophic cascade. The reintroduction of wolves to Yellowstone is often told the same way, with the returning predator reshaping elk behavior and letting streamside vegetation recover. These stories show why losing even one well-connected species can ripple across a whole web of life.
From billions to zero — and back from twenty-seven
Two North American birds bookend what humans can do to biodiversity. The passenger pigeon was once the most abundant bird on the continent, flying in flocks of billions that darkened the sky — yet relentless overhunting and habitat loss drove it to extinction, and the last individual, Martha, died in a zoo in 1914. The California condor nearly followed: by 1987 just 27 birds remained, so biologists captured every one for a captive-breeding program. It worked, and today hundreds of condors again fly wild — proof that determined conservation can pull a species back from the very edge, even if extinction itself can never be undone.
Nature's pharmacy: why a lost species may be a lost cure
A striking share of modern medicines were first discovered in wild organisms, so biodiversity loss can mean losing cures we never found. The cancer drug paclitaxel came from the bark of the Pacific yew tree; the rosy periwinkle, a small plant from Madagascar, yielded compounds that dramatically improved survival for childhood leukemia and Hodgkin's disease; and countless antibiotics trace back to soil microbes. Scientists call the search for such natural compounds bioprospecting. Every species driven extinct closes a chapter of this library before we have even read it — a powerful, self-interested argument for protecting biodiversity.
In the real world
Roughly one out of every three bites of food you eat depends on animal pollinators like bees — so the worldwide decline of pollinators isn't only a wildlife problem, it's a direct threat to the global food supply.
Exit check
Why can habitat corridors help but need case-specific evaluation?
Check your explanation after answering
They can improve movement and gene flow but also transport disease or invasives; compare evidence and target species.
Explain your reasoning without notes. If a key idea is missing, revisit the lesson and try again.
Sustainability & Solutions
Learning goals
- I can explain what sustainability means and interpret the ecological footprint.
- I can describe strategies for living within Earth's limits: conservation, green technology, and policy.
- I can distinguish individual actions from systemic solutions and reason about which has greater leverage.
Readings for this unit
Before this unit
Resource budgets, criteria, technology, and institutions.
Use the detailed parent plan: two core 50–60-minute sessions per focused unit, with a third assigned for selected calculation/modeling topics. First study the core explanation and Parts 1–2 with their figures/checks; next study Parts 3–4, the whole-unit application, worked cases, varied practice and exit check. Attempt reasoning before opening guidance. Extend time when actual understanding requires it; investigations and chapter assessments have separate sessions.
Start with something to explain
Why can a more efficient device fail to reduce total consumption?
Illustrative evidence case. Input per service falls but operating time or demanded service can increase.
Notice and wonder
Record two observations using the stated quantities or relationships. Keep observations separate from possible causes. Write one question that a new measurement could help answer.
Why can a more efficient device fail to reduce total consumption?
Your first model
Separate efficiency, service amount and the monitoring interval.
Build the language from the idea
- sustainability
- Meeting the needs of the present without compromising the ability of future generations to meet their own needs.
- ecological footprint
- A measure of how much productive land and water area a person or population requires to supply what it consumes and absorb the waste it produces.
- biocapacity
- The capacity of an ecosystem, or the whole planet, to regenerate the resources people use and absorb their wastes in a given year.
- renewable energy
- Energy from sources that nature replenishes continuously, such as sunlight, wind, flowing water, and geothermal heat.
- carrying capacity
- The maximum population size an environment can support indefinitely, given its available resources.
Sustainability asks how present needs can be met while preserving options and ecological capacities for future people. Environmental, social, and economic outcomes can reinforce or conflict with one another. Define the service, scale, stakeholders, and timescale for a proposal.
An ecological footprint is a model comparing demand on productive land and water with modeled regenerative capacity. Ratios depend on accounting assumptions and dates. A supplied demand ratio 1.7means 70% above the reference capacity in that model; it is not an undated claim about today.
Reducing unnecessary demand, extending product life, improving efficiency, and recovering materials can lower some impacts. Rebound effects can offset savings if cheaper service increases total use. Distinguish a device efficiency change from an actual system-wide resource reduction.
Renewable sources differ in reliability, land and water requirements, materials, habitat effects, and grid integration. Operational emissions can be low without life-cycle impacts being zero. Compare equal delivered service with storage and infrastructure included where relevant.
Institutions, pricing, standards, land planning, and collective action shape resource decisions. Evaluate a policy by its mechanism, implementation, evidence, distribution of benefits, and unintended effects. Historical environmental agreements illustrate coordination but do not remove the need for ongoing monitoring.
A defensible plan compares options and a baseline, calculates measurable outcomes, states uncertainties, and schedules review. Use the capstone to join physical accounting and ecological evidence while making value judgments explicit. Sustainable is a goal requiring evidence, not a guarantee attached to a technology name.
Model check: No energy technology is impact-free across extraction, manufacture, use, and disposal.
Build your understanding
Use the detailed parent plan: two core 50–60-minute sessions per focused unit, with a third assigned for selected calculation/modeling topics. First study the core explanation and Parts 1–2 with their figures/checks; next study Parts 3–4, the whole-unit application, worked cases, varied practice and exit check. Attempt reasoning before opening guidance. Extend time when actual understanding requires it; investigations and chapter assessments have separate sessions.
Part 1 · Define sustainability by service and constraints
Sustainability concerns maintaining desired functions and well-being within environmental and social constraints over a stated timescale. It cannot be established by a green label or one efficiency value alone. Name the service, affected people and ecosystems, boundary and indicators that would reveal success or decline. Some criteria involve evidence estimates; others express priorities or fairness judgments that should be visible rather than disguised as purely scientific facts.
Read the visual model
Identify the labeled structures and units, then trace the arrows or compare values under the caption’s stated conditions. Separate the displayed evidence from a further inference. Write your reasoning before opening the guidance.
Why is a lower energy bill insufficient to prove a whole system is sustainable?
Visual reasoning — after your attempt
It omits service adequacy, resource and ecological effects, distribution, time horizon and other constraints.
A sustainability proposal should state the service provided, resources used, environmental limits, interval, and affected groups. A renewable label or recycled content alone does not establish that all constraints are met. Scientific measurements inform a decision while priorities and acceptable trade-offs also need explicit choices.
A low-energy design that fails the required service is not an equivalent alternative. Compare the same job before ranking input use.
Pause and explain
Why must the useful service be defined first?
Check your reasoning after answering
Otherwise lower resource use may simply reflect less service, making the alternatives incomparable.
Part 2 · Distinguish efficiency and sufficiency
Efficiency reduces input for a given service. Sufficiency changes how much service is used while meeting agreed needs. Total resource use depends on both. A rebound effect occurs when behavioral or economic responses offset part of a per-service saving, such as longer use after operating cost falls. Rebound is not automatically complete and must be measured; do not assume either zero response or inevitable cancellation without evidence.
Read the visual model
Identify the labeled structures and units, then trace the arrows or compare values under the caption’s stated conditions. Separate the displayed evidence from a further inference. Write your reasoning before opening the guidance.
If energy per service halves while service amount doubles, what happens to total energy?
Visual reasoning — after your attempt
It stays the same under that simple multiplication account.
Efficiency reduces input per useful service; total use also depends on how much service is demanded. A rebound can offset part of an efficiency gain if use expands. Calculate both per-service and total quantities rather than assuming that a more efficient device guarantees lower aggregate demand.
A 20% input reduction per use combined with 50% more uses can increase total input. The two effects multiply.
Pause and explain
Does improved efficiency always reduce total consumption?
Check your reasoning after answering
No. Increased activity, replacement patterns, or other demand changes can offset or exceed the per-service reduction.
Part 3 · Compare options with transparent criteria
A decision matrix records alternatives, criteria, scores and any weights. Scores should use a defined scale and evidence basis; weights express priorities and sum consistently. Here A scores 3.6 and B3.1 with the displayed illustrative weights. That result is conditional, not proof that A is objectively best for every family or community. Test different justified weights and uncertain scores, especially where affected groups have different constraints.
Read the visual model
Identify the labeled structures and units, then trace the arrows or compare values under the caption’s stated conditions. Separate the displayed evidence from a further inference. Write your reasoning before opening the guidance.
Recalculate if all weight goes to affordability. Which option ranks higher?
Visual reasoning — after your attempt
B, with score 4 versus A’s2. The ranking depends on the stated priority.
Use separate criteria for performance, resource use, emissions, reliability, and other relevant impacts. A weighted score contains value choices in its weights; it is not a purely measured universal ranking. Check whether a preferred option fails a required constraint before averaging scores.
A design with a high average score may still be infeasible if it misses an essential water-quality or service requirement.
Pause and explain
Why should hard constraints be checked before a weighted score?
Check your reasoning after answering
Averaging can conceal failure of a nonnegotiable requirement, whereas constraints define whether an option is feasible at all.
Part 4 · Plan implementation and monitor actual results
A proposed solution remains a hypothesis until implementation evidence is examined. A baseline records the starting conditions, a target defines a desired outcome, and a pilot tests a manageable initial version. Monitor service quality, resource use, maintenance and distribution over a relevant interval. If results differ from prediction, examine operating behavior, weather, measurement and model assumptions before revising. Transparent reporting includes unexpected harms and limitations as well as improvements.
Read the visual model
Identify the labeled structures and units, then trace the arrows or compare values under the caption’s stated conditions. Separate the displayed evidence from a further inference. Write your reasoning before opening the guidance.
Why compare weather or usage when evaluating an energy-saving pilot?
Visual reasoning — after your attempt
They can change consumption independently of the design, confounding a simple before/after claim.
A proposal needs responsibility, timing, maintenance, and a measurement plan. Compare actual service and resource use against the baseline, including unintended changes. Revise when evidence shows that performance or assumptions differ from the initial estimate.
Pilot data can reveal changed use behavior or maintenance needs. Keep the original predicted result and explain revisions rather than rewriting the baseline.
Pause and explain
What distinguishes a tested plan from an attractive estimate?
Check your reasoning after answering
Measured pilot outcomes, documented conditions, and criteria for revision connect the prediction to actual performance.
Apply the whole unit · Calculate an efficiency gain with changed demand
Illustrative baseline requires 10.0 kWh per equivalent service,100 services/month. New design requires 8.00 kWh/service, but demand rises to 130 services/month. Assume equal service quality.
Your task
Compare per-service and total energy, quantify the net change, and propose a monitoring measure that distinguishes efficiency from increased demand.
What your response should show
- Define the system, quantities, units, and relevant conditions before selecting a model.
- Show intermediate calculations or a labeled evidence account, including signs or denominators.
- Explain how the supplied evidence supports the conclusion rather than reporting only an answer.
- Identify a meaningful uncertainty, model limit, or measurement needed to test the conclusion.
Response guidance — after your attempt
Baseline energy=10.0×100=1000 kWh/month.
New energy=8.00×130=1040 kWh/month.
Per-service input falls 20%, but total monthly energy rises 4%.
The technology is more efficient per service under the stated assumption, while the activity increase outweighs that saving in the total. Monitor service counts and energy per service separately, and check that quality and operating conditions truly remain comparable. Other impacts and decisions require additional criteria.
Scientific references and source-model foundations
Parent / teacher teaching notes
Have students multiply the two changes rather than subtracting percentages without a denominator. Ask which quantities a pilot must record. Ask the learner to explain each symbol, axis, unit and arrow before calculating. Calculated examples, supplied illustrative records and actual historical observations are labeled separately. Selected public OpenSciEd middle-school source figures are foundation examples, not complete high-school editions or an endorsement; all advanced explanations are supplied locally.
The key idea
Sustainability proposals require explicit service, resource boundaries, evidence, trade-offs, and monitoring. Footprint values depend on model assumptions and dates.
Earths Needed
Earths needed = ecological footprint ÷ biocapacity
the ecological footprint is the productive area a population's consumption requires and biocapacity is the area available to regenerate it (per person, in global hectares); a result above 1 means demand exceeds what the planet can sustainably supply.
Worked examples
Example 1
- The number of Earths needed is the footprint divided by the biocapacity available per person.
- 4.0 gha ÷ 1.6 gha = 2.5.
- Interpret it: a footprint 2.5 times the sustainable share means we'd need 2.5 planets to support everyone at that level of consumption.
Example 2 · Worked application
- Compare the one-time addition with annual savings.
- 120/30=4 years.
- Assume savings are stable and omit other changes only as explicitly stated.
Equivalent transport service and lifetime matter.
Example 3
- Estimate the scale of each. Idle phone chargers draw a tiny amount of power, and the campaign depends on millions of small, voluntary individual actions.
- The coal plant is a single, enormous point source of carbon that supplies the whole city; replacing it changes emissions at the system level, for everyone, at once.
- Both are worth doing, but leverage comes from tackling the largest sources through infrastructure and policy, not from the smallest individual habits.
Example 4 · Find and fix the mistake
- Test the claim against the stated conditions: Equivalent transport service and lifetime matter.
- Construction, replacement and other stages can delay or change lifetime benefit.
Equivalent transport service and lifetime matter.
Example 5 · Reason from the visual model
- A decision matrix records alternatives, criteria, scores and any weights. Scores should use a defined scale and evidence basis; weights express priorities and sum consistently. Here A scores 3.6 and B3.1 with the displayed illustrative weights. That result is conditional, not proof that A is objectively best for every family or community. Test different justified weights and uncertain scores, especially where affected groups have different constraints.
- B, with score 4 versus A’s2. The ranking depends on the stated priority.
Hypothetical scored decision example; no real product or policy is ranked.
Avoid these mistakes
- No energy technology is impact-free across extraction, manufacture, use, and disposal.
Check your understanding
What makes a sustainability proposal measurable?
Discuss the answer
A baseline, defined service and boundary, predicted outcomes, resource/impact accounting, trade-offs, and monitoring.
Return to the phenomenon
Return to the initial case. Why can a more efficient device fail to reduce total consumption? Revise your drawing or explanation using two named ideas and one stated limitation.
Compare explanations after your attempt
Total input depends on both factors; pilot evidence tests actual savings and service quality under explicit priorities.
What should we investigate next?
Which comparison would test a remaining uncertainty? State what you would change, keep comparable and measure.
Investigate, calculate and revise
Keep a first model and an evidence-supported revision. Attempt each task before opening guidance; all required explanations and supplied-data routes are available locally.
Activity 1 · Return to the opening case
Use the opening phenomenon, unit definitions and explained Parts 1–4.
Your task
Return to the initial case. Why can a more efficient device fail to reduce total consumption? Revise your drawing or explanation using two named ideas and one stated limitation.
Success criteria
- Use the stated observations and appropriate units.
- Connect a labeled model with the physical/environmental mechanism.
- State assumptions and an evidence limitation.
- Explain a substantive revision or next test.
Hint
Keep object/material identity, material transfer and energy account distinct.
Response guidance — discuss after your attempt
Total input depends on both factors; pilot evidence tests actual savings and service quality under explicit priorities.
Activity 2 · Transfer to a changed case
Cover the worked answer and use the explained models, relationships and notebook.
Your task
Energy per use falls from 10 to 6 units while annual uses rise from 100 to 140. Find old/new total and percent saving; state a separate service criterion.
Success criteria
- Use the stated measurements or conditions, with correct units.
- Connect the result to the physical or environmental mechanism or evidence relationship.
- Identify the assumption, model limit or further evidence requested.
Hint
Name known quantities and conditions, show intermediate steps and check conservation.
Response guidance — discuss after your attempt
Old=1000 units; new=840; saving=160 units=16%, smaller than the 40% per-use reduction. Adequate service quality, access or reliability needs a separate measure.
Words to know
- sustainability
- Meeting the needs of the present without compromising the ability of future generations to meet their own needs.
- ecological footprint
- A measure of how much productive land and water area a person or population requires to supply what it consumes and absorb the waste it produces.
- biocapacity
- The capacity of an ecosystem, or the whole planet, to regenerate the resources people use and absorb their wastes in a given year.
- renewable energy
- Energy from sources that nature replenishes continuously, such as sunlight, wind, flowing water, and geothermal heat.
- carrying capacity
- The maximum population size an environment can support indefinitely, given its available resources.
In the real world
The price of solar electricity fell by roughly 90% in the 2010 s, turning what was once the most expensive way to make power into frequently the cheapest — a real-world example of green technology scaling up fast enough to change what a sustainable future can look like.
Exit check
What makes a sustainability proposal measurable?
Check your explanation after answering
A baseline, defined service and boundary, predicted outcomes, resource/impact accounting, trade-offs, and monitoring.
Explain your reasoning without notes. If a key idea is missing, revisit the lesson and try again.
Environmental Systems, Feedback & Risk
Learning goals
- I can balance reservoir inputs, outputs, and storage change.
- I can distinguish feedback signs, hazards, exposure, and risk assumptions.
Readings for this unit
Before this unit
Budgets, percentages, ecosystems, and energy/resource decisions.
Use the detailed parent plan: two core 50–60-minute sessions per focused unit, with a third assigned for selected calculation/modeling topics. First study the core explanation and Parts 1–2 with their figures/checks; next study Parts 3–4, the whole-unit application, worked cases, varied practice and exit check. Attempt reasoning before opening guidance. Extend time when actual understanding requires it; investigations and chapter assessments have separate sessions.
Start with something to explain
Why can an average-risk score hide an important tradeoff?
Illustrative evidence case. Rare severe outcomes and frequent modest outcomes can have similar expected loss.
Notice and wonder
Record two observations using the stated quantities or relationships. Keep observations separate from possible causes. Write one question that a new measurement could help answer.
Why can an average-risk score hide an important tradeoff?
Your first model
Separate probability, consequence, exposure, vulnerability and uncertainty.
Build the language from the idea
- reservoir
- A stock of material or energy within a defined system.
- feedback
- An effect that returns to influence its own initiating process.
- exposure
- Contact between a hazard and people or ecosystems.
A systems model specifies reservoirs, flows, and boundaries. For a water budget, storage change=inputs−outputs. If precipitation adds 100 units while runoff and evaporation remove 80, storage rises 20. A missing flow can make a balance look inconsistent even when conservation holds.
A positive feedback amplifies a change; a negative feedback counteracts it. Positive does not mean beneficial and negative does not mean harmful. Ice loss reducing reflectivity can amplify warming; a control that reduces input as storage rises can stabilize a reservoir.
Residence time can be approximated as reservoir amount divided by throughput under a steady-flow model. A 1000unit reservoir with 100 units/year outflow has nominal residence time 10 years. Mixing, changing flows, and multiple pathways can make actual transit times heterogeneous.
Risk combines a hazard with likelihood, exposure, and consequences. An event of low probability can still merit attention when consequences are severe. Expected loss = probability×loss is a useful simplified decision metric, but it does not capture every distributional, ethical, or irreversible consequence.
Engineering choices compare criteria and constraints: treatment effectiveness, energy demand, cost, land, maintenance, and who bears burdens. A weighting table makes priorities explicit but does not turn value choices into physical facts. Test how a conclusion changes with plausible uncertainties or different priorities.
Environmental justice asks how risks and benefits are distributed and whether affected people participate in decisions. A sound proposal identifies stakeholders, documents evidence, and plans monitoring so unintended effects can be discovered and corrected. Uncertainty should guide better measurement and robust choices.
Build your understanding
Use the detailed parent plan: two core 50–60-minute sessions per focused unit, with a third assigned for selected calculation/modeling topics. First study the core explanation and Parts 1–2 with their figures/checks; next study Parts 3–4, the whole-unit application, worked cases, varied practice and exit check. Attempt reasoning before opening guidance. Extend time when actual understanding requires it; investigations and chapter assessments have separate sessions.
Part 1 · Use causal links with a stated boundary
A system is a selected set of interacting components within a boundary. Stocks are accumulated amounts; flows change them per time. A causal link indicates how one variable affects another under stated conditions and need not represent transferred matter. Label link type and units, retain relevant delays and external drivers, and explain why the boundary is appropriate. A diagram’s omission is a modeling choice that can limit predictions.
Read the visual model
Identify the labeled structures and units, then trace the arrows or compare values under the caption’s stated conditions. Separate the displayed evidence from a further inference. Write your reasoning before opening the guidance.
Is an arrow from temperature to respiration necessarily a material flow?
Visual reasoning — after your attempt
No. It can be a causal influence; material and energy accounts need their own quantitative flows.
A systems diagram names variables and directional effects within a selected boundary. A positive link means an increase in one tends to increase the other under the model; it does not mean good. A negative link means an inverse response. Links need mechanisms and conditions rather than correlation alone.
A rainfall-to-runoff link can be positive while a vegetation-to-runoff link depends on soil and event conditions. Define the relationship being modeled.
Pause and explain
What makes a link more than a decorative arrow?
Check your reasoning after answering
A stated mechanism, relevant conditions, and evidence or a testable prediction justify the proposed directional effect.
Part 2 · Distinguish reinforcing loops and balancing loops
A reinforcing loop amplifies an initial change; a balancing loop opposes it. A link sign describes whether increasing one variable increases or decreases the next, holding the relevant context fixed. In this selected ice loop, more warming reduces reflective ice, and more ice reduces warming: two negative links form a reinforcing loop. Delays and additional balancing processes affect the actual response, so the loop alone does not quantify the final outcome.
Read the visual model
Identify the labeled structures and units, then trace the arrows or compare values under the caption’s stated conditions. Separate the displayed evidence from a further inference. Write your reasoning before opening the guidance.
Does one negative link automatically make a whole loop balancing?
Visual reasoning — after your attempt
No. The product of signs around the closed loop determines this classification; delays and other loops still matter.
A reinforcing feedback amplifies an initial change; a balancing feedback opposes it. Time delays, thresholds, and saturation can alter the eventual behavior. Counting signs can help classify a simple loop, but it does not determine its strength or guarantee a particular time trajectory.
A balancing response arriving late can allow overshoot. A reinforcing loop can weaken when a resource limit is reached.
Pause and explain
Does a balancing loop guarantee immediate stability?
Check your reasoning after answering
No. Delays and other interactions can permit oscillation or overshoot; the loop needs a dynamic and quantitative account.
Part 3 · Separate probability, consequence, and exposure
A simple expected loss multiplies event probability by a consequence on a defined comparable scale, summing across mutually specified outcomes. Probability needs an interval and reference class. Exposure concerns who or what is in contact with the hazard; vulnerability affects the damage given that contact. Two options can have similar expected loss but different worst cases, inequality or uncertainty. Explain these dimensions rather than treating one average as the entire decision.
Read the visual model
Identify the labeled structures and units, then trace the arrows or compare values under the caption’s stated conditions. Separate the displayed evidence from a further inference. Write your reasoning before opening the guidance.
Which scenario has larger expected value, and which has the larger single-event consequence?
Visual reasoning — after your attempt
A has expected 10 versus 7.5 for B, and its consequence 100 is also larger; other scenarios could separate those rankings.
A simple expected-impact model multiplies event probability by a specified consequence for compatible units and interval. Equal expected values can conceal very different distributions or effects on people. Hazard, exposure, and vulnerability describe different parts of a risk account.
A rare high-consequence event and a frequent small event can have equal expected loss but different planning implications.
Pause and explain
Why is expected loss not a complete decision rule?
Check your reasoning after answering
It averages outcomes and can conceal extremes, unequal effects, uncertainty, and constraints that require separate consideration.
Part 4 · Test decisions under uncertain scenarios
A scenario range examines outcomes under explicit uncertain assumptions. It is not automatically a statistical confidence interval or a probability distribution. If a decision ranking changes across plausible inputs, identify the threshold and which new evidence would most reduce uncertainty. Some choices can be robust across a range even when the exact probability is unknown. Keep precaution, cost and fairness priorities explicit rather than converting missing information into a claim that risk is zero.
Read the visual model
Identify the labeled structures and units, then trace the arrows or compare values under the caption’s stated conditions. Separate the displayed evidence from a further inference. Write your reasoning before opening the guidance.
What additional evidence would be most useful if only probability drives a ranking reversal?
Visual reasoning — after your attempt
A better justified event-probability estimate for the relevant place, interval and conditions, with its remaining uncertainty.
Compare plausible conditions and sensitivity rather than presenting one uncertain estimate as certainty. Explain what a model omits and what new evidence could change a decision. Precaution, acceptable risk, and distributional priorities are choices informed by science, not outputs of one equation alone.
A flood intervention can reduce one neighborhood’s exposure while shifting water downstream. Expand the boundary to test that possibility.
Pause and explain
What should be checked when an intervention moves a problem?
Check your reasoning after answering
The wider spatial and temporal impacts, affected groups, and resource transfers need examination beyond the initial site boundary.
Apply the whole unit · Compare simplified annual risk scenarios
Illustrative annual event probability 0.10 and conditional impact 100 units. Proposed action reduces probability to 0.04 but raises conditional impact to 150 units. Treat impacts as comparable model units, not actual insurance or financial estimates.
Your task
Calculate expected impacts and percentage change, explain why lower probability alone is insufficient, and identify distribution and uncertainty questions absent from the simple product.
What your response should show
- Define the system, quantities, units, and relevant conditions before selecting a model.
- Show intermediate calculations or a labeled evidence account, including signs or denominators.
- Explain how the supplied evidence supports the conclusion rather than reporting only an answer.
- Identify a meaningful uncertainty, model limit, or measurement needed to test the conclusion.
Response guidance — after your attempt
Baseline expected impact=0.10×100=10 units/year.
Proposed expected impact=0.04×150=6 units/year.
Expected reduction=(10−6)/10=40%; conditional consequence is nevertheless larger.
The proposal improves this expected-value metric but does not guarantee a smaller impact in every realized year. Event probability, conditional consequence, affected groups, extremes, and parameter uncertainty remain important. The product is a supplied planning model, not a validated assessment of a particular location.
Scientific references and source-model foundations
Parent / teacher teaching notes
Ask students to keep probability and consequence as separate quantities. Require an explanation of what the average conceals and one condition that could reverse the comparison. Ask the learner to explain each symbol, axis, unit and arrow before calculating. Calculated examples, supplied illustrative records and actual historical observations are labeled separately. Selected public OpenSciEd middle-school source figures are foundation examples, not complete high-school editions or an endorsement; all advanced explanations are supplied locally.
The key idea
Conservation, feedback, and explicit risk assumptions make environmental decisions traceable.
Worked examples
Example 1
- Δstorage=50−35=15.
- Final=200+15.
Example 2 · Worked application
- The initial change is declining storage.
- The response reduces withdrawals.
- It opposes the original decline, if effective.
Negative does not mean undesirable.
Example 3
- Multiply probability by conditional loss.
- .02×500000.
Example 4 · Find and fix the mistake
- Test the claim against the stated conditions: Negative does not mean undesirable.
- Reinforcing means amplifying a change, which can be helpful or harmful depending on the goal.
Negative does not mean undesirable.
Example 5 · Reason from the visual model
- A simple expected loss multiplies event probability by a consequence on a defined comparable scale, summing across mutually specified outcomes. Probability needs an interval and reference class. Exposure concerns who or what is in contact with the hazard; vulnerability affects the damage given that contact. Two options can have similar expected loss but different worst cases, inequality or uncertainty. Explain these dimensions rather than treating one average as the entire decision.
- A has expected 10 versus 7.5 for B, and its consequence 100 is also larger; other scenarios could separate those rankings.
Illustrative probabilities and comparable consequence units, not a forecast or insurance estimate.
Avoid these mistakes
- Hazard is not identical to risk; exposure and likelihood matter.
Check your understanding
How can a model be improved after an unexpected result?
Discuss the answer
Check boundary and missing flows, measure uncertain parameters, test alternatives, and update predictions and monitoring.
Return to the phenomenon
Return to the initial case. Why can an average-risk score hide an important tradeoff? Revise your drawing or explanation using two named ideas and one stated limitation.
Compare explanations after your attempt
Expected loss is one summary; scenario ranges, distribution and chosen priorities can change the decision.
What should we investigate next?
Which comparison would test a remaining uncertainty? State what you would change, keep comparable and measure.
Investigate, calculate and revise
Keep a first model and an evidence-supported revision. Attempt each task before opening guidance; all required explanations and supplied-data routes are available locally.
Activity 1 · Return to the opening case
Use the opening phenomenon, unit definitions and explained Parts 1–4.
Your task
Return to the initial case. Why can an average-risk score hide an important tradeoff? Revise your drawing or explanation using two named ideas and one stated limitation.
Success criteria
- Use the stated observations and appropriate units.
- Connect a labeled model with the physical/environmental mechanism.
- State assumptions and an evidence limitation.
- Explain a substantive revision or next test.
Hint
Keep object/material identity, material transfer and energy account distinct.
Response guidance — discuss after your attempt
Expected loss is one summary; scenario ranges, distribution and chosen priorities can change the decision.
Activity 2 · Transfer to a changed case
Cover the worked answer and use the explained models, relationships and notebook.
Your task
Event A has probability 0.05 and consequence 200 units; B has probability 0.20 and consequence 40. Find expected losses and explain why the smaller expected value need not settle the choice.
Success criteria
- Use the stated measurements or conditions, with correct units.
- Connect the result to the physical or environmental mechanism or evidence relationship.
- Identify the assumption, model limit or further evidence requested.
Hint
Name known quantities and conditions, show intermediate steps and check conservation.
Response guidance — discuss after your attempt
A=10 units; B=8 units. B has lower expected loss, but worst-case severity, uncertainty, distribution, constraints and priorities still need transparent consideration.
Words to know
- reservoir
- A stock of material or energy within a defined system.
- feedback
- An effect that returns to influence its own initiating process.
- exposure
- Contact between a hazard and people or ecosystems.
In the real world
Use the chapter investigation to connect this unit to measured evidence and a practical decision.
Exit check
How can a model be improved after an unexpected result?
Check your explanation after answering
Check boundary and missing flows, measure uncertain parameters, test alternatives, and update predictions and monitoring.
Explain your reasoning without notes. If a key idea is missing, revisit the lesson and try again.
Environmental Design & Evidence-Based Capstone
Learning goals
- I can compare a baseline and alternatives using explicit criteria and calculations.
- I can plan sensitivity analysis and monitoring that addresses confounding variables.
Readings for this unit
Before this unit
Energy accounting, systems, environmental evidence, and algebra.
Use the detailed parent plan: two core 50–60-minute sessions per focused unit, with a third assigned for selected calculation/modeling topics. First study the core explanation and Parts 1–2 with their figures/checks; next study Parts 3–4, the whole-unit application, worked cases, varied practice and exit check. Attempt reasoning before opening guidance. Extend time when actual understanding requires it; investigations and chapter assessments have separate sessions.
Start with something to explain
How can a family judge whether a proposed environmental design really works?
Illustrative evidence case. A clear service target is compared with reproducible prediction and a monitored pilot.
Notice and wonder
Record two observations using the stated quantities or relationships. Keep observations separate from possible causes. Write one question that a new measurement could help answer.
How can a family judge whether a proposed environmental design really works?
Your first model
Start with the baseline, criteria, constraints and alternative designs.
Build the language from the idea
- baseline
- The defined starting condition for comparison.
- sensitivity analysis
- Recalculation using plausible changes in uncertain inputs.
- simple payback
- Upfront cost divided by annual savings in a simplified model.
A capstone brings evidence from physics and environmental science into a feasible design. Begin with a precise problem such as reducing school building energy use while preserving acceptable lighting and temperature. Define the baseline, required service, constraints, and a measurable success criterion.
Collect or use supplied data on energy, costs, and impacts with units and dates. Separate measurements from assumed factors. A design may include insulation, lighting, scheduling, or a renewable supply; each option should connect a mechanism to an expected measurable outcome.
Calculate annual useful service, electricity use, resource demand, and cost using consistent boundaries. A simple payback estimate is upfront cost divided by annual savings; it ignores discounting, maintenance changes, and uncertain future prices. State those limits rather than presenting it as a complete financial decision.
Compare at least two plausible alternatives plus the baseline. Consider life-cycle impacts, reliability, habitat and water effects, safety, and distribution of benefits. Show a sensitivity case for a key uncertain factor, such as use hours or equipment lifetime, to test whether the ranking is robust.
A test plan identifies a prediction, measurement method, comparison condition, repeats, and a threshold for revision. Post-installation monitoring should compare equivalent seasons or weather-adjusted periods. An observed decline after a change can still be influenced by weather, occupancy, or measurement drift.
Present a report with problem, diagrams, assumptions, calculations, evidence, trade-offs, chosen option, and monitoring. The aim is a defensible decision whose reasoning another person can follow, not a polished claim unsupported by data. Parents can assess reasoning with the guide’s criteria without special equipment.
Build your understanding
Use the detailed parent plan: two core 50–60-minute sessions per focused unit, with a third assigned for selected calculation/modeling topics. First study the core explanation and Parts 1–2 with their figures/checks; next study Parts 3–4, the whole-unit application, worked cases, varied practice and exit check. Attempt reasoning before opening guidance. Extend time when actual understanding requires it; investigations and chapter assessments have separate sessions.
Part 1 · Frame a design problem before choosing a solution
A design brief defines a problem, beneficiaries, criteria and constraints before selecting a favored solution. State the service and baseline so improvement can be measured. A vague goal such as “help the environment” needs a specific boundary and outcome, while a narrow energy target should not hide unacceptable service or access losses. Keep stakeholder needs visible and distinguish must-meet constraints from criteria that can be traded against one another.
Read the visual model
Identify the labeled structures and units, then trace the arrows or compare values under the caption’s stated conditions. Separate the displayed evidence from a further inference. Write your reasoning before opening the guidance.
Why is “install a panel” a weaker problem statement than “deliver a defined service within constraints”?
Visual reasoning — after your attempt
It selects a solution before comparing alternatives or defining whether it meets the actual need.
A capstone begins with a defined service, baseline, affected users, measurable criteria, and constraints. Identify the underlying mechanism rather than beginning with a favored technology. Different proposed solutions must meet the same core task to support a meaningful comparison.
For runoff management, specify area, storm conditions, acceptable retained volume, maintenance, and downstream effects before choosing materials.
Pause and explain
Why is naming a technology not a complete problem statement?
Check your reasoning after answering
It does not specify the required service, baseline, constraints, or evidence needed to decide whether the design succeeds.
Part 2 · Combine models with transparent evidence
A capstone model should identify measured inputs, supplied data, estimated factors and assumptions. Show unit conversions and intermediate steps so another reader can reproduce the result. A prediction is not an observation of the proposed design’s future performance. Compare it with a baseline or pilot and explain which discrepancies could arise from measurement, behavior or model limits. Proper source attribution lets families verify external evidence without making those links the only required teaching reference.
Read the visual model
Identify the labeled structures and units, then trace the arrows or compare values under the caption’s stated conditions. Separate the displayed evidence from a further inference. Write your reasoning before opening the guidance.
What should a report say when household data were not actually collected?
Visual reasoning — after your attempt
Identify the supplied or hypothetical dataset honestly and avoid claiming a performed measurement.
Use relevant physics, ecological, and resource models to generate predictions. Label supplied, measured, estimated, and assumed values separately. Cite actual data sources when used, and keep invented practice data clearly illustrative. A precise calculation is not more reliable than its least-supported inputs.
A storage estimate may use area and rainfall, while infiltration needs soil and timing evidence. Do not substitute one model for every process.
Pause and explain
What should a reader be able to reproduce?
Check your reasoning after answering
The input origins, units, assumptions, calculations, and criteria should be explicit enough to reconstruct and challenge the conclusion.
Part 3 · Test alternatives and uncertainty before selecting
An alternatives analysis compares multiple feasible designs under the same service definition. Here B uses 30 fewer energy units per year but has 40 additional up-front units, giving an energy break-even around 1.33 years if conditions persist. Lifespan, maintenance and service quality can change that conclusion. Examine a plausible range and identify what would reverse the ranking; report non-energy criteria alongside the selected account rather than hiding them inside one unsupported score.
Read the visual model
Identify the labeled structures and units, then trace the arrows or compare values under the caption’s stated conditions. Separate the displayed evidence from a further inference. Write your reasoning before opening the guidance.
What if B lasts only one year before replacement?
Visual reasoning — after your attempt
Its 40-unit extra up-front burden exceeds its 30-unit one-year saving, before replacement impacts and other criteria are considered.
Compare at least two feasible options using the same service and boundary. Check constraints before weighted preferences, and vary uncertain inputs to assess sensitivity. If a ranking changes, report the conditions that determine the decision instead of hiding the reversal.
A low-cost option can fail a required capacity; another can meet capacity but require maintenance that must be included in the plan.
Pause and explain
Why is a sensitivity result useful rather than a weakness to conceal?
Check your reasoning after answering
It reveals which assumptions matter and where a targeted measurement can improve the decision.
Part 4 · Present a pilot, revision, and monitoring plan
A pilot tests a manageable version of the design with a baseline, monitoring plan and success criteria. Keep raw records and compare actual service and resource use with predictions. A useful revision explains why a model or choice changed, including unexpected effects and unresolved uncertainty. The final communication should let another family understand the mechanism, reproduce calculations and judge limits without copying an attractive conclusion. A proposal-only project must be labeled as such.
Read the visual model
Identify the labeled structures and units, then trace the arrows or compare values under the caption’s stated conditions. Separate the displayed evidence from a further inference. Write your reasoning before opening the guidance.
What makes a revision substantive rather than cosmetic?
Visual reasoning — after your attempt
It changes or qualifies the model/design because of specific evidence, a discovered assumption or a tested constraint, with reasoning shown.
A finished proposal should include predictions, a test method, uncertainties, maintenance responsibilities, and success measures. Compare pilot outcomes with predictions and revise transparently. Independent written argument and notebook evidence matter more than a polished poster or one automatically scored answer.
A failed trial can improve a design if its measured cause is examined. Keep dated records of changes and explain what each revision tests.
Pause and explain
What makes a capstone conclusion scientifically defensible?
Check your reasoning after answering
It links a feasible design to reproducible evidence, explicit assumptions, measured criteria, and a plan to test unresolved uncertainties.
Apply the whole unit · Choose and test a runoff-storage design
Illustrative 100 m² paved site receives a 20 mm storm. Model A retains 1000 L; model B retains 1500 L. Required retention is at least 60% of predicted runoff. Initially assume all rain becomes runoff; then test a 25 mm storm.
Your task
Calculate runoff and retention fractions, identify which option meets the constraint in each scenario, and propose a pilot and wider-impact account before recommending construction.
What your response should show
- Define the system, quantities, units, and relevant conditions before selecting a model.
- Show intermediate calculations or a labeled evidence account, including signs or denominators.
- Explain how the supplied evidence supports the conclusion rather than reporting only an answer.
- Identify a meaningful uncertainty, model limit, or measurement needed to test the conclusion.
Response guidance — after your attempt
At 20 mm: volume=100×0.020=2.00 m³=2000 L; A retains 50%, B 75%.
Only B meets 60% at 20 mm. At 25 mm, volume=2500 L; A 40%, B 60%.
B meets the modeled threshold in both cases, with no margin at 25 mm; greater runoff or reduced usable capacity could change feasibility.
The result is conditional on rainfall conversion, available storage, and the absence of other losses or flows. A pilot should measure actual runoff timing, usable capacity, outlet behavior, maintenance, and downstream effects. The arithmetic supports choosing B for further testing under the stated constraint, not immediate approval of a real installation.
Scientific references and source-model foundations
Parent / teacher teaching notes
Use the capstone as a defended report with a diagram, calculations, sensitivity, alternatives, and a monitoring plan. Ask the learner what evidence would make them revise the preferred option. Ask the learner to explain each symbol, axis, unit and arrow before calculating. Calculated examples, supplied illustrative records and actual historical observations are labeled separately. Selected public OpenSciEd middle-school source figures are foundation examples, not complete high-school editions or an endorsement; all advanced explanations are supplied locally.
The key idea
A strong design connects mechanism, numbers, trade-offs, uncertainty, and a testable monitoring plan.
Worked examples
Example 1
- Divide upfront cost by annual savings.
- 600/150.
Example 2 · Worked application
- Removal percentage does not identify final concentration or all relevant contaminants.
- One trial lacks reproducibility and a reliable comparison.
- Safety requires applicable criteria and valid testing, not the invention's label.
Use provided datasets for analysis; do not consume experimental treated water.
Example 3
- 10W=.010 kW.
- .010×2000.
Example 4 · Find and fix the mistake
- Test the claim against the stated conditions: Use provided datasets for analysis; do not consume experimental treated water.
- Scale, durability, maintenance, conditions and repeated independent tests still matter.
Use provided datasets for analysis; do not consume experimental treated water.
Example 5 · Reason from the visual model
- An alternatives analysis compares multiple feasible designs under the same service definition. Here B uses 30 fewer energy units per year but has 40 additional up-front units, giving an energy break-even around 1.33 years if conditions persist. Lifespan, maintenance and service quality can change that conclusion. Examine a plausible range and identify what would reverse the ranking; report non-energy criteria alongside the selected account rather than hiding them inside one unsupported score.
- Its 40-unit extra up-front burden exceeds its 30-unit one-year saving, before replacement impacts and other criteria are considered.
Hypothetical energy-only comparison with equal service assumed; not real product data.
Avoid these mistakes
- Simple payback is a limited model, not a complete cost analysis.
Check your understanding
How would you respond if post-change data failed your prediction?
Discuss the answer
Inspect measurements and confounders, compare actual conditions with assumptions, revise the model or design, and document the evidence.
Return to the phenomenon
Return to the initial case. How can a family judge whether a proposed environmental design really works? Revise your drawing or explanation using two named ideas and one stated limitation.
Compare explanations after your attempt
Connect measurements to a model, test assumptions and compare actual outcomes; communicate evidence-supported revisions and remaining limits.
What should we investigate next?
Which comparison would test a remaining uncertainty? State what you would change, keep comparable and measure.
Investigate, calculate and revise
Keep a first model and an evidence-supported revision. Attempt each task before opening guidance; all required explanations and supplied-data routes are available locally.
Activity 1 · Return to the opening case
Use the opening phenomenon, unit definitions and explained Parts 1–4.
Your task
Return to the initial case. How can a family judge whether a proposed environmental design really works? Revise your drawing or explanation using two named ideas and one stated limitation.
Success criteria
- Use the stated observations and appropriate units.
- Connect a labeled model with the physical/environmental mechanism.
- State assumptions and an evidence limitation.
- Explain a substantive revision or next test.
Hint
Keep object/material identity, material transfer and energy account distinct.
Response guidance — discuss after your attempt
Connect measurements to a model, test assumptions and compare actual outcomes; communicate evidence-supported revisions and remaining limits.
Activity 2 · Transfer to a changed case
Cover the worked answer and use the explained models, relationships and notebook.
Your task
A proposed change saves 12 W for 1500 h/year while providing the same service. Its extra production energy is 24 kWh. Find annual saving and energy break-even; name one pilot measure beyond energy.
Success criteria
- Use the stated measurements or conditions, with correct units.
- Connect the result to the physical or environmental mechanism or evidence relationship.
- Identify the assumption, model limit or further evidence requested.
Hint
Name known quantities and conditions, show intermediate steps and check conservation.
Response guidance — discuss after your attempt
Annual saving=0.012×1500=18 kWh. Energy break-even=24/18≈1.33 years under fixed use/lifespan assumptions. Measure service adequacy, reliability, actual hours, access or maintenance as a separate pilot outcome.
Words to know
- baseline
- The defined starting condition for comparison.
- sensitivity analysis
- Recalculation using plausible changes in uncertain inputs.
- simple payback
- Upfront cost divided by annual savings in a simplified model.
In the real world
Use the chapter investigation to connect this unit to measured evidence and a practical decision.
Exit check
How would you respond if post-change data failed your prediction?
Check your explanation after answering
Inspect measurements and confounders, compare actual conditions with assumptions, revise the model or design, and document the evidence.
Explain your reasoning without notes. If a key idea is missing, revisit the lesson and try again.
Problem 1
Answer and explanation
(a) habitat loss, (b) invasive species, (c) overexploitation.
(a) Clearing the mangrove removes the natural habitat, so this is habitat loss/destruction — the largest driver overall. (b) A non-native vine spreading and harming native trees is an invasive species. (c) Killing elephants faster than the population can replace itself is overexploitation. All three appear in the HIPPO list of biodiversity threats.
Problem 2
Answer and explanation
75%.
Area lost = 8,000 - 2,000 = 6,000 hectares. Dividing by the original area: 6,000 ÷ 8,000 = 0.75, or 75% of the forest habitat lost. Only a quarter of the original forest remains.
Problem 3
Answer and explanation
Fragmentation isolates populations, shrinks patches below what some species need, and increases harmful edge effects, so the divided habitat supports less biodiversity than the same area kept intact.
Even with the same total area, breaking a habitat into isolated patches causes several problems. Populations in different patches are cut off from one another, reducing gene flow and making local extinctions more likely. Wide-ranging or large species may need more continuous space than any single small patch provides. And more edge means more of the habitat is exposed to drying winds, sunlight, predators, and invasive species that penetrate from the surrounding farmland. So fragmentation can reduce biodiversity even when the raw acreage is unchanged — which is why connecting habitat with corridors is a key conservation strategy.
Problem 4
Answer and explanation
About 5 Earths.
Earths needed = footprint ÷ biocapacity per person = 8.0 gha ÷ 1.6 gha = 5.0. If every person on the planet consumed at this level, humanity would need five Earths' worth of resources and waste absorption — a stark illustration that the highest-consumption lifestyles cannot scale to the whole global population.
Problem 5
Answer and explanation
It shows that when science identifies a global pollutant and nations coordinate policy to phase it out, an Earth system can recover — evidence that climate change is also solvable through international, system-level action rather than individual effort alone.
The Montreal Protocol worked because nearly every country agreed to the same binding phase-out of CFCs, replacing them with safer chemicals across entire industries at once. Because the change was made at the level of laws and whole industries — not left to individual consumers — it reached the true source of the problem, and the ozone layer began healing within decades. This is encouraging for climate change: the largest emissions come from how societies produce energy, move goods, and grow food, which are shaped by policy and infrastructure. Individual choices help and build momentum, but coordinated, system-level policy has the leverage to cut emissions at their source — just as it did for ozone.
Problem 6
Answer and explanation
They can improve movement and gene flow but also transport disease or invasives; compare evidence and target species.
Response criteria
- State a scientifically accurate conclusion.
- Show the calculation or mechanism that supports it.
- Include units, conditions, or limits where relevant.
Problem 7
Answer and explanation
Decline=(500−350)/500=30%. Living individuals remain in the defined population, and the record alone cannot distinguish survival, reproduction, movement or the pressures affecting them.
Decline=(500−350)/500=30%.
Living individuals remain in the defined population, and the record alone cannot distinguish survival, reproduction, movement or the pressures affecting them.
Response criteria
- Use the stated measurements or conditions, with correct units.
- Connect the result to the physical or environmental mechanism or evidence relationship.
- Identify the assumption, model limit or further evidence requested.
Problem 8
Answer and explanation
A baseline, defined service and boundary, predicted outcomes, resource/impact accounting, trade-offs, and monitoring.
Response criteria
- State a scientifically accurate conclusion.
- Show the calculation or mechanism that supports it.
- Include units, conditions, or limits where relevant.
Problem 9
Answer and explanation
Old=1000 units; new=840; saving=160 units=16%, smaller than the40% per-use reduction. Adequate service quality, access or reliability needs a separate measure.
Old=1000 units; new=840; saving=160 units=16%, smaller than the40% per-use reduction.
Adequate service quality, access or reliability needs a separate measure.
Response criteria
- Use the stated measurements or conditions, with correct units.
- Connect the result to the physical or environmental mechanism or evidence relationship.
- Identify the assumption, model limit or further evidence requested.
Problem 10
Hints
Write the relationship first; substitute with consistent units.
Answer and explanation
25 units
120−95=25.
Problem 11
Answer and explanation
They may differ in extreme outcomes, who is exposed, reversibility, and uncertainty.
Response criteria
- State a scientifically accurate conclusion.
- Show the calculation or mechanism that supports it.
- Include units, conditions, or limits where relevant.
Problem 12
Answer and explanation
A=10 units; B=8 units. B has lower expected loss, but worst-case severity, uncertainty, distribution, constraints and priorities still need transparent consideration.
A=10 units; B=8 units.
B has lower expected loss, but worst-case severity, uncertainty, distribution, constraints and priorities still need transparent consideration.
Response criteria
- Use the stated measurements or conditions, with correct units.
- Connect the result to the physical or environmental mechanism or evidence relationship.
- Identify the assumption, model limit or further evidence requested.
Problem 13
Answer and explanation
Measured outcomes, method, comparison period, controls for confounders, schedule, and revision criteria.
Response criteria
- State a scientifically accurate conclusion.
- Show the calculation or mechanism that supports it.
- Include units, conditions, or limits where relevant.
Problem 14
Hints
Write the relationship first; substitute with consistent units.
Answer and explanation
3 years
900/300=3.
Problem 15
Answer and explanation
Annual saving=0.012×1500=18 kWh. Energy break-even=24/18≈1.33 years under fixed use/lifespan assumptions. Measure service adequacy, reliability, actual hours, access or maintenance as a separate pilot outcome.
Annual saving=0.012×1500=18 kWh.
Energy break-even=24/18≈1.33 years under fixed use/lifespan assumptions.
Measure service adequacy, reliability, actual hours, access or maintenance as a separate pilot outcome.
Response criteria
- Use the stated measurements or conditions, with correct units.
- Connect the result to the physical or environmental mechanism or evidence relationship.
- Identify the assumption, model limit or further evidence requested.