Ecosystems, Matter & Energy — Print · Life Science & Scientific Inquiry, Grade 7
Five focused units, a three-session investigation, chapter review, and chapter quiz.
Printable chapter lessons and review.
Energy Flow, Food Chains & Food Webs
Learning goals
- I can explain energy flow, food chains & food webs.
- I can use evidence, a model, and stated assumptions to support a biological explanation.
Before this unit
Use the supplied vocabulary, distinguish an observation from an explanation, and identify any units or model assumptions. Revisit a connected earlier unit if needed; new terms are explained here.
Use three flexible 40–45-minute sessions: core background and Parts 1–2 with their checks; Parts 3–4 and the worked application; then remaining practice, a labeled model, revision, and the exit check. Checks completed during reading can count toward the practice set. Read one short part at a time. Investigations and chapter review/quiz have separate sessions, and flexible weeks allow more time.
In 1995, grey wolves were returned to Yellowstone after a seventy-year absence. The elk, which had been browsing unchecked, began avoiding the open valleys where they were vulnerable. Willow and aspen recovered along the streams. Beavers, which need willow, increased. Songbirds returned to the regrown cover, and the changed vegetation altered the banks of the rivers themselves. Exactly how much of this the wolves caused is still argued about by ecologists, and that argument is part of the lesson — but the case shows what an ecosystem is: a community of organisms and their physical surroundings, connected tightly enough that a change in one place turns up in others nobody was watching.
The connections are feeding relationships, and the roles have names. A producer builds its own food from simple materials using an outside energy source — almost always a plant or alga using light. A consumer obtains energy by eating other organisms, directly or at a remove. A decomposer breaks down dead material and waste, releasing the matter locked in it back into the soil and air. Every organism occupies one of these roles in a given relationship, and a food web is the whole set of them in a place, with arrows showing where energy and matter go.
The arrow convention is worth fixing immediately, because it is the most common source of error: an arrow points from the organism being eaten to the organism doing the eating, in the direction the energy and matter travel. Grass points to rabbit; rabbit points to fox. Read the other way the web becomes nonsense. The second thing to hold onto runs through the entire chapter: matter cycles and energy flows. A carbon atom can go round indefinitely — air, plant, rabbit, fox, decomposer, air again. Energy cannot. It enters as sunlight, passes along the arrows with a large fraction lost as heat at every step, and leaves. Nothing recycles it, which is why an ecosystem needs a continuous supply of light rather than a stock of energy going round.
Build your understanding
Where this fits
The course has worked from cells up to whole organisms and how they reproduce and inherit. This chapter steps outside the organism entirely, to the matter and energy moving between them. The first unit sets out who depends on whom, and the distinction between energy flowing and matter cycling that the whole chapter rests on.
Use three flexible 40–45-minute sessions: core background and Parts 1–2 with their checks; Parts 3–4 and the worked application; then remaining practice, a labeled model, revision, and the exit check. Checks completed during reading can count toward the practice set. Read one short part at a time. Investigations and chapter review/quiz have separate sessions, and flexible weeks allow more time.
Part 1 · Roles are defined by how an organism gets its energy
A producer is defined by building its own food from simple inorganic materials using an external energy source — light for plants and algae, and in a few places chemical energy from rock or vents. A consumer is defined by obtaining its energy from other organisms. The role is about the pathway, not about the kind of organism, which keeps the definitions working in unfamiliar cases.
Decomposers are the role most often left out, and the ecosystem will not work without them. Fungi and bacteria break down dead organisms and waste, which does two things at once: it releases energy for themselves, and it returns the matter — carbon, nitrogen, phosphorus — to forms producers can take up again. Without decomposition the nutrients would be locked in dead material and the cycling would stop.
An organism can occupy different roles in different relationships. A fox eating a rabbit is a consumer; a fox's body after death is material for decomposers. A plant is a producer and also food. Describing roles in terms of a particular relationship, rather than labelling species permanently, is what keeps a web accurate.
Pause and explain
Why are decomposers essential rather than merely tidy?
Check your reasoning after answering
Because they return matter to the system. Breaking down dead organisms and waste releases carbon, nitrogen and other nutrients in forms producers can take up again, which is what allows matter to cycle. Without decomposition those materials would stay locked in dead tissue and producers would run out of what they need, however much sunlight continued to arrive.
Part 2 · Reading arrows the right way
The arrow points in the direction energy and matter move: from the eaten to the eater. Grass → rabbit → fox. Many people draw it the other way, reasoning that the fox goes to the rabbit, and the whole diagram then says the opposite of what is intended.
State the convention when you draw or read one. It costs a line and removes the ambiguity, and it also makes the diagram checkable: anyone can confirm that each arrow runs from a source of energy to something obtaining energy from it.
The arrows carry information beyond direction, but less than people assume. They say that a feeding relationship exists. They do not say how often it happens, how much of the predator's diet it represents, or how much energy actually moves. A thin dependency and a critical one look identical on the page, which matters for the prediction question later in this unit.
Pause and explain
In a food web, which way does the arrow between grass and rabbit point, and why?
Check your reasoning after answering
From grass to rabbit, because the arrow shows the direction energy and matter travel — from the organism being eaten to the one eating it. Drawing it the other way reverses the meaning of the whole diagram. Stating the convention alongside the web makes it checkable by anyone reading it.
Part 3 · From single chains to a web
A food chain is a single path: grass to rabbit to fox. A web is what you get when you draw all the chains in one place together, and it looks different, because most organisms eat several things and are eaten by several things. That branching is the important structural fact, and a single chain gives a misleading picture of how a real community behaves.
Branching provides alternatives, which makes a web more stable than a chain. If insects decline in a web where mice eat both insects and seeds, mice have another route; in a chain with no alternative, the effect would pass straight through. More connections generally mean more resilience, which the biodiversity unit in the next chapter develops.
Branching also makes prediction harder, and honestly so. A change at one point can propagate in several directions at once, with effects that may partly cancel. The Yellowstone case is argued over precisely because the web is complicated: the wolves' return coincided with other changes, and separating their contribution from drought, from the bear population, and from recovering beaver numbers is genuinely difficult.
Pause and explain
Why is a food web more stable than a single food chain?
Check your reasoning after answering
Because branching provides alternatives. If one food source declines in a web, consumers that also eat something else can shift, so the effect is absorbed rather than passed straight along. In a chain with no alternatives, a loss at one point passes directly to everything above it. More connections generally mean more resilience.
Part 4 · Energy flows one way; matter goes round
Follow a carbon atom. It enters a plant from the air as carbon dioxide, becomes part of a sugar and then a leaf; a rabbit eats the leaf and the atom becomes rabbit tissue; a fox eats the rabbit; the fox dies and decomposers release the atom to the air again. The same atom can make that circuit indefinitely. Matter cycles, because there is a return path.
Now follow the energy. Sunlight is captured in a sugar; the rabbit obtains some of it; much of the rest was used by the plant's own respiration and lost as heat. At every step the same thing happens, and heat released to the surroundings cannot be recovered to do work. There is no return path for energy, which is why an ecosystem must be continuously supplied with light.
The practical consequence is a test you can apply to any ecological claim. If an account has energy going round a loop, it is wrong. If it has matter being used up and gone, it is usually wrong too. Keeping the two in separate columns — matter cycling, energy flowing one way and leaving as heat — resolves most of the confusion in this chapter before it starts.
Pause and explain
Why does an ecosystem need a continuous supply of sunlight when it does not need a continuous supply of carbon?
Check your reasoning after answering
Because matter has a return path and energy does not. Carbon atoms cycle between air, producers, consumers and decomposers indefinitely, so the same atoms are reused. Energy enters as light, passes along the feeding arrows, and leaves as heat at every transfer, with no way back. It must therefore be replaced continuously.
Apply the whole unit · Predict from a supplied web
Illustrative web, not a surveyed ecosystem: grass feeds insects and rabbits; insects and seeds feed mice; mice and rabbits feed foxes. A decline in insects is recorded, and no counts are given for the other resources.
Your task
Trace one pathway the insect decline could affect, and explain why the exact change in mice or foxes cannot be determined from this web.
What your response should show
- Explain the relevant biological process accurately.
- Use the supplied evidence and show calculation steps with units where needed.
- Connect a labeled model or mechanism with the claim.
- State an assumption, evidence limitation, or useful next observation.
Response guidance — after your attempt
Trace the pathway: fewer insects means less food reaching mice along that arrow, which could reduce mouse numbers and in turn reduce food reaching foxes.
Identify the alternatives the web shows: mice also eat seeds, and foxes also eat rabbits, so each has another route.
State what the web omits: arrows show that a relationship exists, not how much of each diet it supplies or how strongly each consumer depends on it.
Name what would be needed: counts of seeds and rabbits over the same interval, and a measure of what proportion of each consumer's diet each source provides.
One affected pathway runs grass → insects → mice → foxes. A decline in insects reduces the food arriving at mice along that arrow, which could reduce mouse numbers, and fewer mice could in turn mean less food reaching foxes. That is a plausible chain of effects and it is as far as the web supports going. The exact change in mice cannot be determined, because mice also eat seeds, and the web does not say what proportion of a mouse's diet comes from insects rather than seeds, nor whether seeds are plentiful or scarce over the same interval. If seeds are abundant, mice may be barely affected; if insects were most of their intake, the effect could be large. The same reasoning applies one step further up: foxes also eat rabbits, so even a substantial fall in mice might be offset, and rabbit numbers are not recorded either. The general limitation is that an arrow in a food web states that a feeding relationship exists and nothing about its strength — a critical dependency and an occasional meal look identical on the page. To make a quantitative prediction you would need the proportion of each consumer's diet supplied by each source, counts of the other resources over the same interval, and some measure of how quickly each population responds, since effects move through a web with delays. Without those, the honest statement names the direction of a possible effect and the alternatives that could absorb it.
Scientific references for this unit
Parent / teacher teaching notes
Ask for a because-statement and a labeled relationship, not just a memorized word. Work through one calculation step at a time, permit oral or diagram responses, and use flexible sessions for difficult reading. Compare the learner’s actual evidence with the supplied model; do not reward copying or agreement with a personal preference. No private family, genetic, or medical records are required.
The key idea
An ecosystem includes organisms and their physical environment. Producers build organic molecules using an energy source, commonly sunlight in the ecosystems studied here. Consumers obtain organic matter by eating organisms or their products. Decomposers use dead material and wastes, transferring matter into other forms. These are functional roles, not ranks of importance.
Worked examples
Example 1 · Correct a reversed web
- Check the convention: arrows run from the organism eaten to the organism eating it, following energy and matter.
- Redraw accordingly: grass → rabbit → fox.
- Correct the wording: a rabbit eats grass rather than hunting it, and the arrow records the transfer of energy and matter, not an act of pursuit.
Follow the energy. If the arrow does not point the way the energy goes, it is backwards.
Example 2 · Say what a web cannot predict
- Identify what the web shows: that foxes feed on both, and nothing about the proportions.
- Consider the alternative route: if mice are plentiful, foxes may shift towards them and be little affected.
- Consider the other direction: fewer foxes eating rabbits could let rabbits recover, and more fox pressure on mice could reduce mice.
An arrow is a relationship, not a quantity. Magnitudes need measurements.
Avoid these mistakes
- Mistake: arrows point from the eater to the eaten. They follow energy and matter, from the organism eaten to the one eating it — grass to rabbit to fox.
- Mistake: energy cycles round the web. Matter cycles; energy enters as light and leaves as heat at every transfer, which is why continuous sunlight is needed and continuous carbon is not.
- Mistake: decomposers are optional tidying. They return nutrients to forms producers can use, without which cycling stops even with sunlight still arriving.
- Mistake: a web lets you predict how much a population will change. An arrow shows that a relationship exists, not its strength; magnitudes need diet proportions and counts.
Check your understanding
Why is a decomposer not outside the food system?
Discuss the answer
It obtains and transfers organic matter and energy from dead material and wastes within connected pathways.
Which way should an arrow point from an eaten seed to a seed-eating bird?
Discuss the answer
From seed to bird, because the bird receives matter and stored energy from the seed.
Words to know
- ecosystem
- A community of organisms together with their physical surroundings, connected closely enough that a change in one part appears in others.
- producer
- An organism building its own food from simple materials using an outside energy source, almost always light.
- consumer
- An organism obtaining energy by eating others; the role describes a relationship rather than labelling a species permanently.
- food web
- All the feeding relationships in a place drawn together, with arrows running from the eaten to the eater.
- decomposer
- An organism breaking down dead material and waste, returning carbon and nutrients to forms producers can use again.
Extend your scientific explanation
Compare a second supplied example or the linked educational reference. Identify a connection, a model limit, and an additional observation that would test the explanation.
In the real world
Use a clear question, reliable observations, and a biological mechanism to evaluate a claim. State what remains uncertain before applying a classroom model to a different setting.
Exit check
Do decomposers recycle all usable energy back to plants?
Check your explanation after answering
No. They recycle matter into other forms while energy transfers and much dissipates as heat.
Explain your reasoning without notes. If a key idea is missing, revisit the lesson and try again.
Energy Pyramids & Transfer Efficiency
Learning goals
- I can explain energy pyramids & transfer efficiency.
- I can use evidence, a model, and stated assumptions to support a biological explanation.
Before this unit
Use the supplied vocabulary, distinguish an observation from an explanation, and identify any units or model assumptions. Revisit a connected earlier unit if needed; new terms are explained here.
Use three flexible 40–45-minute sessions: core background and Parts 1–2 with their checks; Parts 3–4 and the worked application; then remaining practice, a labeled model, revision, and the exit check. Checks completed during reading can count toward the practice set. Read one short part at a time. Investigations and chapter review/quiz have separate sessions, and flexible weeks allow more time.
There is no ecosystem on Earth with a food chain twenty steps long. Chains run to four or five links and then stop, and the reason is arithmetic rather than accident. At every transfer from one feeding position to the next, most of the energy does not arrive. A trophic position is a place in that sequence — producers first, then the organisms eating them, then the organisms eating those — and the transfer efficiency is the fraction of energy at one position that ends up at the next.
Follow where the rest goes, because the losses are not mysterious. Much of the energy an organism takes in is released by its own respiration to power everything it does, and ends up as heat. Some of what it eats is never digested and leaves as waste. Parts of organisms are not eaten at all — bones, bark, roots. And organisms die and go to decomposers rather than to a predator. None of this is energy destroyed; it is energy that went somewhere other than the next feeding position, which is a crucial distinction.
An energy pyramid is the diagram that shows this, with each level's energy drawn to scale, and it is always a pyramid because each level is far smaller than the one below. A figure of ten per cent is often quoted as a rule of thumb, and it is worth knowing that real measured efficiencies range from around one per cent to over twenty, depending on the organisms and conditions. Treating ten per cent as a law rather than a rough average is a mistake this unit is built to prevent. Pyramids can also be drawn for biomass, the total mass of living material, which usually gives a similar shape but can behave differently — in some ocean systems fast-reproducing producers support a greater mass of consumers at any one instant, so the energy pyramid and the biomass pyramid do not look the same. The underlying quantity in an energy budget is energy, and that is the one that never inverts.
Build your understanding
Where this fits
The last unit established that energy flows one way through a web and is lost at every transfer. This unit quantifies that loss, which explains something the web alone cannot: why food chains are short, and why there are so few large predators compared with the plants at the bottom.
Use three flexible 40–45-minute sessions: core background and Parts 1–2 with their checks; Parts 3–4 and the worked application; then remaining practice, a labeled model, revision, and the exit check. Checks completed during reading can count toward the practice set. Read one short part at a time. Investigations and chapter review/quiz have separate sessions, and flexible weeks allow more time.
Part 1 · Saying exactly what the pyramid measures
A pyramid can be drawn for different quantities and they are not interchangeable. An energy pyramid shows the energy passing through each level over a stated period — a flow, with units of energy per time. A biomass pyramid shows the mass of living material present at one moment — a standing stock. A numbers pyramid counts individuals, and can be the wrong shape entirely, since one oak supports thousands of insects.
Stating which one you mean is therefore part of reading it. The period matters too: energy through a level over a year is a different figure from energy over a day, and comparing two pyramids built over different intervals is meaningless.
The energy pyramid is the one that cannot invert. However fast producers reproduce, they cannot pass on more energy than they captured, so each level above must receive less. A biomass pyramid can appear inverted at an instant because standing stock is not the same as throughput — a small mass of algae turning over rapidly can support a larger mass of grazers.
Pause and explain
Why can a biomass pyramid sometimes look inverted while an energy pyramid never can?
Check your reasoning after answering
Because biomass is a standing stock at one moment and energy is a flow over a period. Fast-reproducing producers, such as ocean algae, can be present in small mass at any instant while passing a large amount of energy through over time, supporting a greater mass of consumers. Energy through a level can never exceed what the level below passed on.
Part 2 · Calculating a transfer from stated figures
The calculation is a fraction expressed as a percentage: energy reaching the next level, divided by energy at the current level, times a hundred. The only skill is identifying the two numbers correctly and dividing in the right order.
Work the model. Producers provide 2,000 units; first consumers receive 300; second consumers receive 60, all over the same interval. The first transfer is 300 ÷ 2,000 = 0.15, which is 15%. The second is 60 ÷ 300 = 0.2, which is 20%. Two transfers with different efficiencies, and neither one is ten per cent.
That result is the point of the exercise. The ten per cent figure is an average across many systems, not a law each transfer obeys, and applying it as a rule would have given 200 and 20 instead of the stated 300 and 60. Where a measurement is available, use it; where it is not, say that you are using a rough average and that real values vary from about one per cent to over twenty.
Pause and explain
Producers provide 2,000 units and first consumers receive 300. What is the transfer efficiency, and does it match the ten per cent rule?
Check your reasoning after answering
It is 300 ÷ 2,000 = 0.15, which is 15%. It does not match ten per cent, and it does not need to: ten per cent is a rough average across many systems rather than a law. Measured efficiencies range from about one per cent to over twenty, so a stated figure should always be used in preference to the rule of thumb.
Part 3 · Where the rest of the energy went
If 2,000 units are available and 300 reach the next level, 1,700 went somewhere else, and naming the routes prevents the error this unit most wants to avoid. Most of it was used by the producers' own respiration, powering their growth, transport and maintenance, and released as heat. Some of the plant material was never eaten — roots, woody stems, parts that died and went to decomposers.
At the consumer level the same routes apply plus two more. Not everything eaten is digested, and the rest leaves as waste for decomposers. And consumers that die without being eaten take their energy to decomposers as well. Decomposers are a major destination for energy at every level, which is why they are missing from a simple pyramid and present in a complete energy budget.
None of these routes destroys energy. The 1,700 units were transferred to heat, to decomposers, or to parts of the system the pyramid does not draw, and the total is conserved throughout. The pyramid narrows because energy leaves the chain, not because it stops existing — and saying which routes it left by is what turns a diagram into an explanation.
Pause and explain
2,000 units are available at the producer level and 300 reach the first consumers. Where did the other 1,700 go?
Check your reasoning after answering
To the producers' own respiration, released as heat as they grew and maintained themselves; to parts never eaten, such as roots and woody tissue; and to decomposers, via plant material that died without being consumed. None of it was destroyed — it left the chain by routes the pyramid does not draw, and the total is conserved.
Part 4 · What a pyramid supports, and what it does not
Pyramids explain structural facts well. Chains are short because after four or five transfers at these efficiencies there is too little energy left to support another level. Large predators are rare because each one needs an enormous base beneath it. And a given area supports far more people fed on plants directly than on animals fed on those plants — one transfer rather than two.
What pyramids do not support is prediction about particular populations. They are summaries over a stated interval for a stated system, and they say nothing about which species, how numbers will change next season, or what happens if one link is removed. The web from the previous unit is better for structure and still cannot give magnitudes.
So state the interval, the system and the source of the figures, and keep the claim at the level the evidence supports. "In this modelled system over this interval, 15% of producer energy reached the first consumers" is a finding. "Ecosystems transfer ten per cent" is a rule of thumb being presented as a measurement.
Pause and explain
Why are food chains rarely longer than four or five links?
Check your reasoning after answering
Because only a small fraction of energy passes to each next level — often in the region of ten per cent, though it varies widely. After four or five transfers, the energy remaining from the original producer input is too small to support another feeding position. The limit is arithmetic, which is also why large predators are rare and need a large base beneath them.
Apply the whole unit · Follow two different transfer fractions
Illustrative energy model, not measured data: over the same interval, producers provide 2,000 units, first consumers receive 300, and second consumers receive 60.
Your task
Calculate both transfer percentages, and explain why the ten-per-cent shortcut and any claim that energy was destroyed are both wrong.
What your response should show
- Explain the relevant biological process accurately.
- Use the supplied evidence and show calculation steps with units where needed.
- Connect a labeled model or mechanism with the claim.
- State an assumption, evidence limitation, or useful next observation.
Response guidance — after your attempt
First transfer: 300 ÷ 2,000 = 0.15, which is 15%.
Second transfer: 60 ÷ 300 = 0.2, which is 20%.
Reject the shortcut: the two transfers differ from each other and neither is ten per cent, which is an average across systems rather than a law.
Account for the missing energy: 1,700 units and then 240 went to respiration as heat, to uneaten parts, to undigested waste and to decomposers — transferred elsewhere, not destroyed.
The two transfers are 15% and 20%. The first is 300 ÷ 2,000 = 0.15 and the second is 60 ÷ 300 = 0.2, and the fact that they differ is the first thing worth noticing: a single efficiency does not apply across a chain, and neither value is the ten per cent often quoted. That figure is a rough average across many studied systems, with real measurements ranging from around one per cent to over twenty, so applying it as a rule here would have predicted 200 and 20 units instead of the 300 and 60 the model states. Where a measured or stated figure exists, it should be used; where none does, a calculation should say explicitly that it is using an approximation. The second error to avoid is treating the shortfall as destruction. At the first transfer, 2,000 − 300 = 1,700 units did not reach the consumers, and every one of them went somewhere. Most was used by the producers' own respiration and released as heat as they grew, transported materials and maintained themselves. Some was in parts never eaten — roots, woody stems — and some was in plant material that died and went to decomposers. At the second transfer the same routes apply, plus food that was eaten but not digested and left as waste, and consumers that died without being eaten. Energy is conserved throughout; what the pyramid shows is energy leaving the chain, not ceasing to exist. That is also why the chain is short: at these efficiencies, a fourth or fifth level has too little arriving to sustain it.
Scientific references for this unit
Parent / teacher teaching notes
Ask for a because-statement and a labeled relationship, not just a memorized word. Work through one calculation step at a time, permit oral or diagram responses, and use flexible sessions for difficult reading. Compare the learner’s actual evidence with the supplied model; do not reward copying or agreement with a personal preference. No private family, genetic, or medical records are required.
The key idea
An energy pyramid represents measured or modeled energy at successive feeding positions for a defined area and interval. It commonly decreases upward because organisms use energy in their own processes and some matter is not consumed or assimilated. Much transferred energy eventually spreads as heat rather than becoming food for the next position.
Worked examples
Example 1 · Compare a measured figure with the rule of thumb
- Calculate the actual transfer: 250 ÷ 5,000 = 0.05, which is 5%.
- Apply the rule of thumb for comparison: ten per cent of 5,000 would be 500 units.
- Compare: the rule would have overestimated by a factor of two, because this system's efficiency is half the average.
Always divide the stated figures. Reach for ten per cent only when nothing better exists, and say so.
Example 2 · Argue from the pyramid to a structural fact
- Count the transfers in each case: plants to people is one transfer; plants to livestock to people is two.
- Apply an efficiency at each step: each transfer passes on only a fraction, so two transfers multiply two fractions together.
- Compare the outcomes: at roughly ten per cent per step, one transfer delivers about ten per cent of the crop energy and two deliver about one per cent.
Count the transfers. Each one multiplies the loss rather than adding to it.
Avoid these mistakes
- Mistake: ten per cent is the transfer efficiency. It is a rough average; the modelled transfers here are 15% and 20%, and real measurements range from about one per cent to over twenty.
- Mistake: the missing energy was destroyed. It went to respiration as heat, to uneaten parts, to undigested waste and to decomposers — conserved, but outside the chain.
- Mistake: an energy pyramid and a biomass pyramid are the same diagram. One is a flow over time and cannot invert; the other is a standing stock and sometimes can.
- Mistake: a pyramid predicts population changes. It summarises energy over a stated interval for a stated system and says nothing about which species or what happens next season.
Check your understanding
Why can a few trees support many insects without contradicting energy flow?
Discuss the answer
Individual count differs from energy amount; organisms vary greatly in size and available energy.
If 200 of 1,000 units transfer, what percentage is modeled?
Discuss the answer
200/1,000×100=20%, rather than an assumed universal ten percent.
Words to know
- trophic position
- A place in the feeding sequence — producers, then those eating them, then those eating those.
- transfer efficiency
- The fraction of energy at one position reaching the next, expressed as a percentage; measured values range from about one per cent to over twenty.
- energy pyramid
- A diagram of the energy passing through each level over a stated period; unlike a biomass pyramid, it can never invert.
- biomass
- The total mass of living material, a standing stock at one moment rather than a flow over time.
- energy budget
- A full account of where energy goes, including respiration as heat, uneaten parts, waste and decomposers — the routes a pyramid leaves out.
Extend your scientific explanation
Compare a second supplied example or the linked educational reference. Identify a connection, a model limit, and an additional observation that would test the explanation.
In the real world
Use a clear question, reliable observations, and a biological mechanism to evaluate a claim. State what remains uncertain before applying a classroom model to a different setting.
Exit check
Can a 10% energy transfer identify exact predator count?
Check your explanation after answering
No. Count depends on each organism’s needs and other ecological information not supplied by that fraction.
Explain your reasoning without notes. If a key idea is missing, revisit the lesson and try again.
Carbon, Water & Cycling Matter
Learning goals
- I can explain carbon, water & cycling matter.
- I can use evidence, a model, and stated assumptions to support a biological explanation.
Before this unit
Use the supplied vocabulary, distinguish an observation from an explanation, and identify any units or model assumptions. Revisit a connected earlier unit if needed; new terms are explained here.
Use three flexible 40–45-minute sessions: core background and Parts 1–2 with their checks; Parts 3–4 and the worked application; then remaining practice, a labeled model, revision, and the exit check. Checks completed during reading can count toward the practice set. Read one short part at a time. Investigations and chapter review/quiz have separate sessions, and flexible weeks allow more time.
The carbon in the breath you just exhaled was, a few hours ago, part of something you ate; before that it was in a plant; before that it was in the air, possibly having been exhaled by someone else. Atoms are not consumed. They are moved between stores and rearranged into different molecules, over and over, and the same atoms have been doing this for as long as there has been life. A reservoir is one of those stores — the atmosphere, the oceans, living organisms, soil, rock — and a cycle is the set of processes moving matter between them.
The carbon cycle runs on processes this course has already covered. Photosynthesis moves carbon from the air into living tissue. Respiration, in plants and animals alike, moves it back out. Feeding moves it from organism to organism. Decomposition releases it from dead material. Burning moves it from fuels to the air quickly, and over long periods carbon accumulates in rock and sediment and returns slowly. The cycle is one loop, and the thing worth noticing is that respiration and photosynthesis are the two main arrows running in opposite directions.
Water cycles too, by change of state rather than by chemical reaction. Evaporation lifts it from surfaces to the air; transpiration does the same through the pores of plant leaves, and in a forest that is a large fraction of the total; condensation turns vapour back to liquid as air cools, forming cloud; precipitation returns it; and runoff carries it across the surface to rivers and the sea, while some soaks into the ground. To follow matter through any of this you draw a boundary, count what crosses in and out, and work out the storage change — which is what the pond model at the end of this unit does.
Build your understanding
Where this fits
Energy flows through and leaves. Matter does not: it cycles, which is why a decomposer's work matters as much as a producer's. This unit follows two substances round their loops, and brings back the balance-sheet method from the kidney unit as the way to check any claim about where matter has gone.
Use three flexible 40–45-minute sessions: core background and Parts 1–2 with their checks; Parts 3–4 and the worked application; then remaining practice, a labeled model, revision, and the exit check. Checks completed during reading can count toward the practice set. Read one short part at a time. Investigations and chapter review/quiz have separate sessions, and flexible weeks allow more time.
Part 1 · Carbon through living processes
Start with the two opposing arrows. Photosynthesis takes carbon dioxide from the air and builds it into glucose, so carbon moves from the atmosphere into living tissue. Respiration breaks glucose down and releases carbon dioxide, so carbon moves back. Plants do both; animals do only the second. Over a day in good light a plant takes in more than it releases, which is how it grows.
Then feeding moves carbon between organisms. The carbon in a rabbit was in grass; the carbon in a fox was in the rabbit. No new carbon is created at any step; it is relocated and rearranged, which is why an ecosystem can keep running on the same atoms indefinitely while needing a continuous supply of energy.
Decomposition is the return path that completes the loop. Dead organisms and waste are broken down by fungi and bacteria, which respire and release carbon dioxide, returning carbon to the air and nutrients to the soil. Without it, carbon would accumulate in dead material and producers would eventually be starved of it — which is roughly what happened over long stretches of geological time, producing coal.
Pause and explain
Name the two processes that move carbon in opposite directions between air and living things.
Check your reasoning after answering
Photosynthesis moves carbon from the atmosphere into living tissue, building carbon dioxide into glucose. Respiration moves it back, breaking glucose down and releasing carbon dioxide. Plants carry out both and animals only the second, and decomposition is the further return path releasing carbon from dead material.
Part 2 · Reservoirs, and how fast matter moves between them
A reservoir is a store, and the useful questions about one are how much it holds and how quickly matter enters and leaves it. The atmosphere holds a modest amount of carbon and exchanges it rapidly. Living organisms hold more and exchange over years to centuries. Soil and sediment hold a great deal and exchange slowly. Rock holds vastly more and exchanges over geological time.
Rates matter as much as amounts, and this is where the distinction becomes practically important. Burning a fossil fuel moves carbon from a slow reservoir — rock and sediment, where it accumulated over millions of years — into a fast one, the atmosphere, within seconds. The carbon is not new, and the total is unchanged; what has changed is which reservoir holds it and how quickly the transfer happened.
That reframing is worth holding onto, because it explains why conservation of matter and a changing atmosphere are not in conflict. Matter being conserved says nothing about where it is. A cycle can be entirely closed and still have one of its reservoirs grow at the expense of another.
Pause and explain
If matter is conserved, how can the amount of carbon in the atmosphere change?
Check your reasoning after answering
Because conservation says the total is unchanged, not that its distribution is. Carbon moves between reservoirs — atmosphere, organisms, soil, ocean, rock — and one can grow while another shrinks. Burning fuel transfers carbon from a slow reservoir where it accumulated over millions of years into the atmosphere in seconds, without creating any.
Part 3 · Water, states and the plant pathway
Water cycles by changing state rather than by reacting. Liquid water at a surface gains enough energy for molecules to escape as vapour — evaporation. Vapour cooling in rising air loses energy and returns to liquid droplets — condensation, which is cloud. Those droplets grow and fall as precipitation. The energy driving all of it comes from the Sun.
Plants add a pathway that is easy to overlook. Transpiration is the loss of water vapour through pores in leaves, and it is not incidental: it is what pulls water up from the roots through the whole plant. In a forested region, transpiration can account for a large share of the water returning to the air, which is why removing forest changes local water movement.
On the ground, water that does not soak in becomes runoff, flowing across the surface to streams and rivers. How much soaks in depends on the surface — soil with good pore space takes up a great deal, compacted or paved ground almost none — which is the link to the soil unit next and to the human impact unit in the following chapter.
Pause and explain
What is transpiration, and why does it matter beyond the individual plant?
Check your reasoning after answering
It is the loss of water vapour through pores in leaves, and it is what draws water up from the roots through the plant. Beyond the individual, it returns a large share of water to the air in vegetated regions, so removing forest reduces that return and changes local water movement — which is why land cover affects more than the plants on it.
Part 4 · Balancing a store within a stated boundary
To track matter you need a boundary, as the kidney unit established. Decide what is inside — here, a pond — then list every pathway crossing it, sort them into inputs and outputs, and calculate the change in storage as inputs minus outputs. The arithmetic is simple and the discipline is what catches errors.
Work the model. Over an interval, rain adds 40 L and runoff adds 20 L, so inputs total 60 L. Evaporation removes 25 L and outflow removes 15 L, so outputs total 40 L. The storage change is 60 − 40 = +20 L: the pond gains 20 L over the interval.
Two things that look contradictory are both true here. The pond's contents changed, and matter was conserved throughout — every litre is accounted for by a pathway crossing the boundary. A store growing or shrinking is not a violation of conservation; it is what conservation predicts when inputs and outputs differ. The model also states that other pathways are excluded, and a real pond would have groundwater exchange and uptake by organisms, so the 20 L is the answer for the stated boundary rather than for a real pond.
Pause and explain
A pond gains 40 L of rain and 20 L of runoff, and loses 25 L to evaporation and 15 L to outflow. What is the storage change, and does it break conservation of matter?
Check your reasoning after answering
Inputs total 60 L and outputs total 40 L, so storage increases by 20 L. It does not break conservation. Every litre is accounted for by a pathway crossing the stated boundary; conservation says the total is unchanged, and a store growing simply means more entered than left over that interval.
Apply the whole unit · Balance an illustrative water store
Illustrative pond interval, not measured data: rain adds 40 L; runoff adds 20 L; evaporation removes 25 L; outflow removes 15 L. All other pathways are excluded by the model.
Your task
Calculate the change in storage, label each pathway as an input or an output, and explain how a changing amount of water is consistent with matter being conserved.
What your response should show
- Explain the relevant biological process accurately.
- Use the supplied evidence and show calculation steps with units where needed.
- Connect a labeled model or mechanism with the claim.
- State an assumption, evidence limitation, or useful next observation.
Response guidance — after your attempt
Sort the pathways: rain and runoff cross inward as inputs; evaporation and outflow cross outward as outputs.
Total the inputs: 40 L + 20 L = 60 L entering over the interval.
Total the outputs: 25 L + 15 L = 40 L leaving over the interval.
Calculate the storage change: 60 L − 40 L = +20 L, so the pond gains 20 L.
The pond gains 20 L over the interval. Rain at 40 L and runoff at 20 L are the inputs, crossing the boundary inward and totalling 60 L. Evaporation at 25 L and outflow at 15 L are the outputs, crossing outward and totalling 40 L. The change in storage is inputs minus outputs: 60 − 40 = +20 L. That increase is entirely consistent with matter being conserved, and the two ideas are often confused. Conservation says that water is not created or destroyed, not that any particular store stays the same size. Every litre in this model is accounted for by a pathway across a stated boundary: the 20 L the pond gained came from the rain and runoff that entered and did not leave. A store grows whenever inputs exceed outputs and shrinks when they do not, and in both cases the total water in the wider system is unchanged — it has simply moved between reservoirs, exactly as carbon does when it moves from rock to atmosphere. Two limits are worth stating. The model explicitly excludes other pathways, and a real pond would exchange water with groundwater through its bed, lose some to organisms and gain some from them, and might overflow differently at different levels. And the figures are for one stated interval, so they cannot be extended to a season without knowing how rainfall and evaporation vary. The method, though, transfers directly: name the boundary, list the pathways, sort them, and subtract.
Scientific references for this unit
Parent / teacher teaching notes
Ask for a because-statement and a labeled relationship, not just a memorized word. Work through one calculation step at a time, permit oral or diagram responses, and use flexible sessions for difficult reading. Compare the learner’s actual evidence with the supplied model; do not reward copying or agreement with a personal preference. No private family, genetic, or medical records are required.
The key idea
Matter moves among organisms, air, water, and soil. Carbon dioxide can supply carbon for photosynthetic food production; feeding transfers organic matter; respiration and decomposition return carbon to other forms. Some reservoirs store carbon for long periods, so a cycle does not mean every atom completes the same path quickly.
Worked examples
Example 1 · Balance a store and find a missing pathway
- Calculate the change the stated pathways predict: 30 − 12 = +18 L.
- Compare with the measurement: the pond gained only 5 L, which is 13 L less than predicted.
- Interpret: a further output of about 13 L must exist that the account omitted — outflow, seepage into the ground, or uptake by organisms.
When inputs minus outputs does not match the observed change, suspect a missing pathway first.
Example 2 · Reconcile conservation with a rising reservoir
- State what conservation claims: the total amount of carbon is unchanged by ordinary chemical and biological processes.
- Distinguish total from distribution: carbon sits in several reservoirs and moves between them.
- Apply it: moving carbon from rock and sediment into the atmosphere by burning increases one reservoir and decreases another, leaving the total the same.
Conservation constrains the total. It says nothing about where the matter is.
Avoid these mistakes
- Mistake: conservation of matter means a store cannot change. It means the total is unchanged; a pond gaining 20 L or an atmosphere gaining carbon is matter moving between reservoirs.
- Mistake: only animals respire, so plants only add oxygen. Plants respire continuously too; over a day in good light photosynthesis exceeds it, which is how they grow.
- Mistake: the water cycle is evaporation and rain. Transpiration through leaves returns a large share of water in vegetated regions, and how much soaks in versus runs off depends on the surface.
- Mistake: a balance that does not close means conservation failed. It means a pathway is missing from the account, which is exactly what the method is for finding.
Check your understanding
Does sunlight supply the carbon atoms in sugar?
Discuss the answer
No. Carbon dioxide supplies carbon matter in the plant model; light supplies energy.
Does a cycle mean no reservoir can change?
Discuss the answer
No. Inputs and outputs can differ over an interval, changing a reservoir’s stored amount.
Words to know
- reservoir
- A store of matter — atmosphere, ocean, organisms, soil, rock — characterised by how much it holds and how fast matter enters and leaves.
- transpiration
- Loss of water vapour through pores in leaves, which draws water up from the roots and returns much of a region's water to the air.
- condensation
- Vapour returning to liquid as air cools, forming cloud; a change of state rather than a chemical reaction.
- runoff
- Water flowing across the surface to streams and rivers instead of soaking in; how much depends on the surface.
- storage change
- Inputs minus outputs across a stated boundary; a store can grow or shrink while matter is conserved overall.
Extend your scientific explanation
Compare a second supplied example or the linked educational reference. Identify a connection, a model limit, and an additional observation that would test the explanation.
In the real world
Use a clear question, reliable observations, and a biological mechanism to evaluate a claim. State what remains uncertain before applying a classroom model to a different setting.
Exit check
Why can a pond lose water while matter is conserved?
Check your explanation after answering
Water can leave its chosen boundary through evaporation, flow, or other transfers and remain elsewhere in the larger system.
Explain your reasoning without notes. If a key idea is missing, revisit the lesson and try again.
Decomposition, Soil & Nutrient Availability
Learning goals
- I can explain decomposition, soil & nutrient availability.
- I can use evidence, a model, and stated assumptions to support a biological explanation.
Before this unit
Use the supplied vocabulary, distinguish an observation from an explanation, and identify any units or model assumptions. Revisit a connected earlier unit if needed; new terms are explained here.
Use three flexible 40–45-minute sessions: core background and Parts 1–2 with their checks; Parts 3–4 and the worked application; then remaining practice, a labeled model, revision, and the exit check. Checks completed during reading can count toward the practice set. Read one short part at a time. Investigations and chapter review/quiz have separate sessions, and flexible weeks allow more time.
A fallen leaf disappears within a year in a warm damp wood and can still be recognisable after a decade in a cold dry one. Nothing about the leaf differs; the conditions do. Decomposition is a biological process carried out by living organisms, so anything that affects those organisms affects the rate — and that is the key to this unit, because it explains both why tropical soils and arctic soils behave so differently and why a compost heap works faster when you turn it.
Soil is not simply dirt. It is a mixture of four things: mineral particles broken down from rock, organic matter from decomposed organisms, water, and air held in the spaces between particles. That last component is easy to forget and is essential, because roots and soil organisms respire and need oxygen. The pore space between particles holds both the water and the air, and its size and arrangement determine how much water drains away, how much is held where roots can reach it, and whether oxygen can get in.
Decomposition is the breakdown of dead material and waste by fungi, bacteria and small animals, and from their point of view it is simply feeding — they are consumers obtaining energy from material that was recently alive. What makes it matter to everything else is the by-product: as they break material down, they release nutrients in forms producers can take up through their roots. When you measure decomposition you usually measure dry mass, the mass with the water driven off, because water content varies from day to day and would otherwise swamp the signal you are looking for.
Build your understanding
Where this fits
The last unit named decomposition as the return path that completes a cycle and left it at that. This unit opens it up, because decomposition happens in soil and soil is where the matter cycle meets the resources plants actually draw on — which is also where the next chapter's questions about land and human impact begin.
Use three flexible 40–45-minute sessions: core background and Parts 1–2 with their checks; Parts 3–4 and the worked application; then remaining practice, a labeled model, revision, and the exit check. Checks completed during reading can count toward the practice set. Read one short part at a time. Investigations and chapter review/quiz have separate sessions, and flexible weeks allow more time.
Part 1 · What soil is made of
The mineral fraction comes from rock broken down physically and chemically over long periods, and the size of those particles sets much of a soil's behaviour. Sand particles are large, so the pores between them are large, water drains quickly and air gets in easily. Clay particles are tiny, the pores are tiny, water is held tightly and air is scarce. Most useful soils are mixtures.
The organic fraction comes from decomposed organisms. It holds water, supplies nutrients as it continues to break down, and binds mineral particles into crumbs with spaces between them — so adding organic matter improves both water holding and air supply, which is why compost helps sandy and clay soils for different reasons.
Water and air share the pore space and compete for it. A waterlogged soil has no air, so roots and soil organisms cannot respire, and decomposition slows or shifts to organisms that manage without oxygen. A bone-dry soil has plenty of air and no water for the organisms to live in. Good soil structure is the arrangement that holds enough of both.
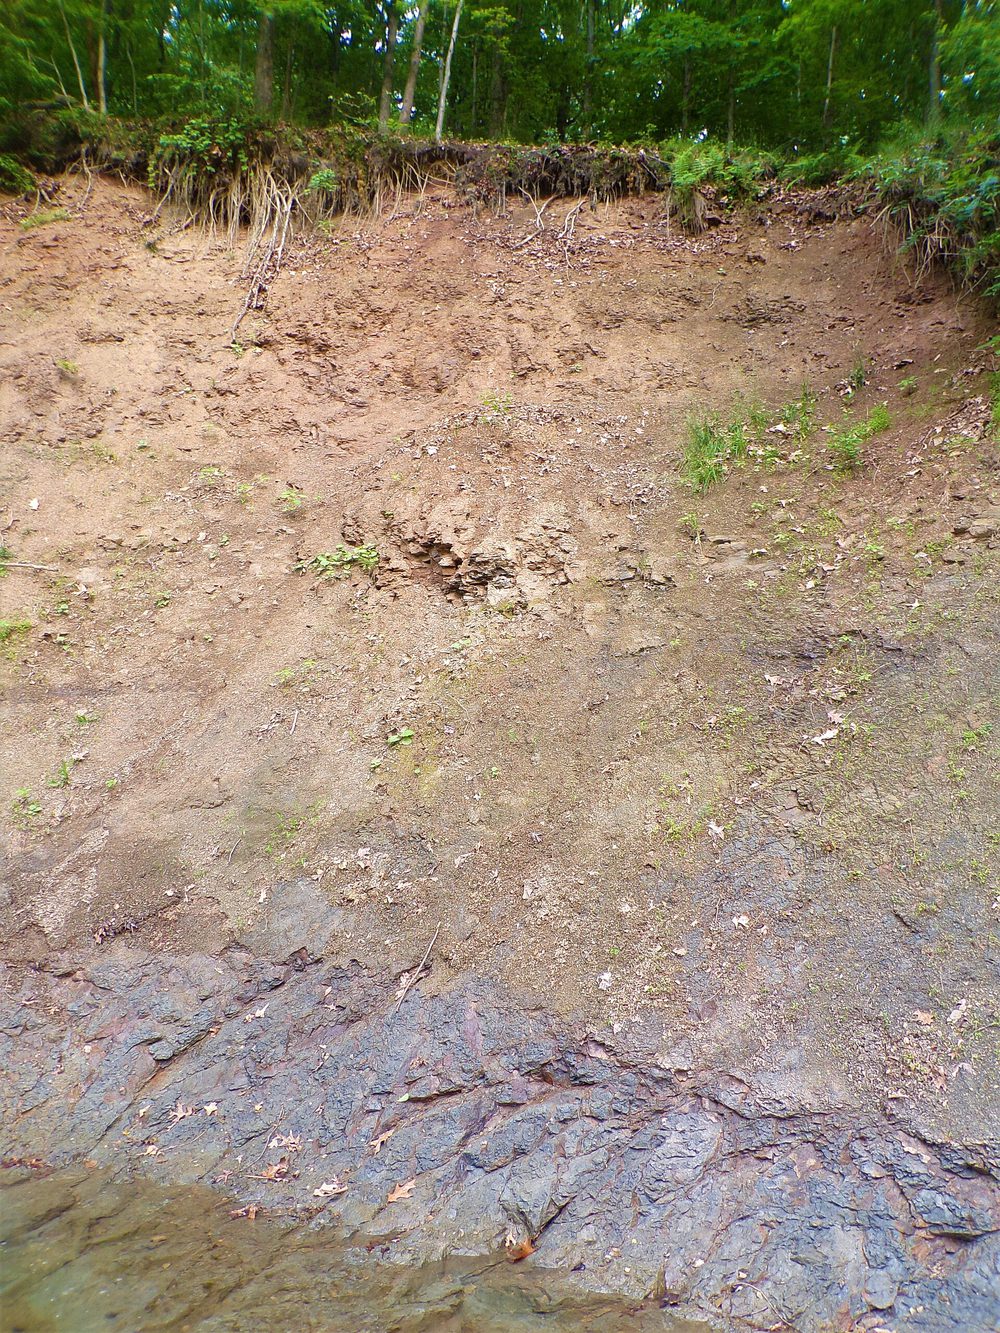
Pause and explain
Why does a waterlogged soil cause problems for plants even though plants need water?
Check your reasoning after answering
Because water and air share the pore space, and waterlogging fills it with water. Roots and soil organisms respire and need oxygen, so with no air in the pores they cannot release the energy they need. Decomposition also slows or shifts to organisms that work without oxygen, which changes what nutrients become available.
Part 2 · Decomposers as consumers with a useful by-product
From the decomposer's side, dead material is food. Fungi and bacteria secrete enzymes onto it, break large molecules into small ones, absorb those, and respire them for energy — the same chemistry as any other consumer, run outside the body rather than in a gut. Small animals such as worms and springtails contribute by fragmenting material, increasing the surface area available, which is the same principle as chewing from the digestion unit.
The consequence for everything else is release. Carbon returns to the air as carbon dioxide from the decomposers' respiration, and nitrogen, phosphorus and other nutrients are released into the soil in forms roots can absorb. Producers depend on this entirely: the nutrients in a growing plant were, for the most part, in a dead organism not long before.
So decomposition is both an energy story and a matter story, and keeping them apart is the habit this chapter keeps returning to. The energy in dead material passes to decomposers and leaves the system as heat, following the one-way rule. The matter returns to the soil and air and is used again, following the cycling rule.
Pause and explain
In what sense are decomposers consumers?
Check your reasoning after answering
They obtain their energy from material that was recently alive, which is the definition of a consumer. The difference is where the digestion happens: fungi and bacteria secrete enzymes onto the material and absorb the small molecules, rather than taking food into a gut. Their by-product is the release of carbon and nutrients in forms producers can use.
Part 3 · Comparing decomposition rates fairly
Because decomposition is carried out by organisms, its rate responds to temperature, moisture, oxygen and the nature of the material. A fair comparison therefore holds all but one of these constant, which is the method from Chapter 1 applied to a tray of litter.
Measure it as a loss of dry mass over a stated interval. Take matched samples, dry them to constant mass at the start, expose them to the treatments, dry them again at the end, and compare. Drying matters: a sample that simply absorbed water would appear to have gained mass, and one that dried out would appear to have decomposed.
Work the model. Two matched samples each start at 20 g of dry material; after the same interval, A ends at 14 g and B at 18 g, with moisture as the treatment and other conditions stated matched. A lost 6 g and B lost 2 g, so A lost 4 g more. That is a clear difference, and attributing it to moisture is reasonable given matched conditions — though the measurement is of mass lost, not of decomposition directly, which the final section takes up.
Pause and explain
Two matched 20 g samples end at 14 g and 18 g. What were the losses, and what does the comparison support?
Check your reasoning after answering
A lost 20 − 14 = 6 g and B lost 20 − 18 = 2 g, so A lost 4 g more over the same interval. With other conditions stated as matched and moisture as the treatment, the comparison supports moisture affecting the rate of mass loss under these conditions — a narrower claim than moisture causing decomposition in general.
Part 4 · What the boundary leaves out, and the trade-off
Mass loss from a sample is not quite the same as decomposition, and the gap is worth naming. Material can leave a sample by being washed out, by being carried off by an animal, or by physical crumbling, none of which is biological breakdown. A careful study states its boundary: what was inside the sample, what could cross out of it, and which routes were prevented.
There is also a trade-off in soil management that this unit sets up for the next chapter. Fast decomposition releases nutrients quickly, which plants can use, but it also depletes the store of organic matter that holds water and structure. Slow decomposition builds that store and keeps nutrients locked up. Neither is simply better, and which is preferable depends on what the soil is for.
That is the honest shape of most environmental questions, and the design unit in the next chapter makes it explicit: options have criteria they meet and costs they carry, and choosing between them means stating both rather than declaring one correct.
Pause and explain
Why is mass loss from a sample not exactly the same as decomposition?
Check your reasoning after answering
Because material can leave a sample by routes that are not biological breakdown — washed out by water, carried off by an animal, or physically crumbled away. A careful comparison states the boundary: what was in the sample, which routes out were possible, and which were prevented, so the loss can be attributed to decomposition rather than assumed.
Apply the whole unit · Compare decomposition records
Illustrative dry-material study over one interval, not measured data: matched samples each start at 20 g. Sample A ends at 14 g and sample B at 18 g. The moisture treatment differs between them; all other conditions are stated as matched.
Your task
Calculate the mass loss for each sample, state the pattern the comparison supports, and name a limitation arising from the boundary.
What your response should show
- Explain the relevant biological process accurately.
- Use the supplied evidence and show calculation steps with units where needed.
- Connect a labeled model or mechanism with the claim.
- State an assumption, evidence limitation, or useful next observation.
Response guidance — after your attempt
Calculate A's loss: 20 g − 14 g = 6 g.
Calculate B's loss: 20 g − 18 g = 2 g.
Compare: A lost 4 g more than B over the same interval, which is three times as much.
State the boundary limitation: mass could leave a sample by washing out, physical crumbling or removal by animals, so the measurement is of mass lost rather than of decomposition directly.
Sample A lost 20 − 14 = 6 g and sample B lost 20 − 18 = 2 g, so A lost 4 g more over the same interval — three times B's loss. Because the samples started matched at 20 g of dry material and all conditions other than moisture are stated as matched, the comparison is structured to attribute that difference to the moisture treatment, which is more than most informal comparisons manage. The supported claim is that under these conditions, over this interval, the wetter treatment was associated with three times the dry-mass loss. Using dry mass is deliberate and worth noting: a sample weighed wet could appear to gain mass simply by absorbing water, or appear to decompose by drying out, so drying to constant mass at both ends is what makes the figures comparable at all. The boundary limitation is that mass loss and decomposition are not the same quantity. Material can leave a sample by being washed out in solution, by crumbling physically, or by being carried off by an animal, and none of those is biological breakdown — yet all of them would show up as mass lost. A stronger study would state which routes out were possible and which were prevented, for instance by enclosing the samples in mesh fine enough to exclude larger animals while admitting water and microorganisms, and would ideally measure carbon dioxide released as a direct signal of decomposer respiration. Two samples run once is also a small study, so repetition would be needed before treating the threefold difference as reliable.
Scientific references for this unit
Parent / teacher teaching notes
Ask for a because-statement and a labeled relationship, not just a memorized word. Work through one calculation step at a time, permit oral or diagram responses, and use flexible sessions for difficult reading. Compare the learner’s actual evidence with the supplied model; do not reward copying or agreement with a personal preference. No private family, genetic, or medical records are required.
The key idea
Soil is a changing mixture of mineral particles, organic material, water, air spaces, and organisms. Dead leaves are not simply converted into new plants. Decomposers process organic material, release energy through their own metabolism, and move nutrients into forms that can enter other pathways. Plants need suitable resources as well as an energy source.
Worked examples
Example 1 · Explain a rate difference from conditions
- Identify who does the work: fungi, bacteria and small animals, all living organisms with their own requirements.
- Apply temperature: their enzymes and respiration work faster in warmth, within limits, so cold slows everything they do.
- Apply moisture: these organisms need water to live and to move; a dry environment limits both their activity and their numbers.
When a biological rate changes, ask what changed for the organisms doing the work.
Example 2 · Improve a study's boundary
- List routes out that are not decomposition: soluble material washed out by rain, fragments blown or crumbled away, material removed by animals or birds.
- Ask whether the treatment could affect those routes rather than decomposition — a wetter tray loses more to washing out as well as decomposing faster.
- Propose a design change that closes or equalises the non-biological routes.
Ask what else could remove mass. The measurement is of mass, not of the process you are interested in.
Avoid these mistakes
- Mistake: soil is just dirt. It is mineral particles, organic matter, water and air, and the air in the pore space is essential because roots and soil organisms respire.
- Mistake: decomposers are not consumers. They obtain energy from material that was recently alive, digesting it outside their bodies; their useful by-product is releasing nutrients for producers.
- Mistake: mass loss measures decomposition. Material also leaves by washing out, crumbling and removal by animals, so the boundary and the routes out have to be stated.
- Mistake: faster decomposition is simply better. It releases nutrients quickly and depletes the organic matter that holds water and structure, which is a trade-off rather than an improvement.
Check your understanding
Why are spaces in soil relevant?
Discuss the answer
They can hold air and water and affect movement and root conditions, rather than being biologically meaningless empty areas.
Do decomposers return usable energy as sunlight?
Discuss the answer
No. They change matter pathways while energy transfers through metabolism and heat; continued energy input is still needed.
Words to know
- soil
- A mixture of mineral particles, organic matter, water and air; the air in the pores is as essential as the water.
- nutrient
- A substance a plant takes up through its roots, released into the soil largely by decomposers breaking down dead material.
- decomposition
- Breakdown of dead material by fungi, bacteria and small animals feeding on it, which returns carbon to the air and nutrients to the soil.
- pore space
- The spaces between soil particles, shared by water and air; its size determines drainage, water holding and oxygen supply.
- dry mass
- Mass with the water driven off, used because water content varies daily and would otherwise swamp the change being measured.
Extend your scientific explanation
Compare a second supplied example or the linked educational reference. Identify a connection, a model limit, and an additional observation that would test the explanation.
In the real world
Use a clear question, reliable observations, and a biological mechanism to evaluate a claim. State what remains uncertain before applying a classroom model to a different setting.
Exit check
Why is “more water always improves soil conditions” unsupported?
Check your explanation after answering
Water can occupy air spaces and interact with other conditions; the effect depends on the organism and setting.
Explain your reasoning without notes. If a key idea is missing, revisit the lesson and try again.
Habitats, Resources & Population Change
Learning goals
- I can explain habitats, resources & population change.
- I can use evidence, a model, and stated assumptions to support a biological explanation.
Before this unit
Use the supplied vocabulary, distinguish an observation from an explanation, and identify any units or model assumptions. Revisit a connected earlier unit if needed; new terms are explained here.
Use three flexible 40–45-minute sessions: core background and Parts 1–2 with their checks; Parts 3–4 and the worked application; then remaining practice, a labeled model, revision, and the exit check. Checks completed during reading can count toward the practice set. Read one short part at a time. Investigations and chapter review/quiz have separate sessions, and flexible weeks allow more time.
In 1944, twenty-nine reindeer were put ashore on St Matthew Island in the Bering Sea, where there were no predators and the ground was deep in lichen. By 1963 there were six thousand. Three years later there were forty-two. The lichen that had taken centuries to accumulate was gone, a severe winter finished what overgrazing had started, and the population collapsed almost completely. Nothing about the reindeer changed. What changed was the relationship between how many there were and what the island could supply.
Some definitions make that story analysable. A population is all the individuals of one species in a defined area at a defined time — the definition needs both, since a count without a boundary and a date means nothing. A community is all the populations of different species in that area together. The factors acting on them divide in two: a biotic factor is a living one, such as food, predators, disease or competitors, and an abiotic factor is a non-living one, such as temperature, water, light, soil or space.
Populations change through exactly four pathways, and listing them is the foundation of this unit. Births and immigration add individuals; deaths and emigration remove them. Any change in a count is the net result of those four and nothing else. Carrying capacity is the idea that an environment can support only so many of a species given its resources, and that as a population approaches that number, growth slows — because food runs short, waste accumulates, disease spreads more readily, or space runs out. The reindeer overshot theirs, which is possible when a resource can be consumed faster than it regrows, and the correction was brutal.
Build your understanding
Where this fits
This chapter has followed energy and matter through an ecosystem. The last unit turns to the organisms themselves: how a population changes, what limits it, and why counting the same place twice tells you less than it appears to. It is also the method the sampling unit in the next chapter builds on.
Use three flexible 40–45-minute sessions: core background and Parts 1–2 with their checks; Parts 3–4 and the worked application; then remaining practice, a labeled model, revision, and the exit check. Checks completed during reading can count toward the practice set. Read one short part at a time. Investigations and chapter review/quiz have separate sessions, and flexible weeks allow more time.
Part 1 · Defining the population before counting it
A population needs a species, an area and a time. "The rabbit population" is not a measurable thing; "the rabbits in this twelve-hectare field in June 2026" is. Without a boundary there is no way to say whether an individual counts, and without a date there is nothing to compare a later count against.
The boundary also determines what counts as movement. A rabbit crossing the field edge is emigration from your population even though it is alive and well a metre away. That sounds like an artefact of the definition, and it is — which is exactly why the definition has to be stated, so that anyone reading your figures knows what they include.
This matters in practice because populations rarely sit neatly inside a chosen boundary. Birds move between study areas, seeds blow in, and a species' range does not respect a fence. Stating the boundary does not solve that; it makes the limitation visible, which is what allows someone else to judge the figures.
Pause and explain
Why is "the deer population" not yet a measurable quantity?
Check your reasoning after answering
Because it names no area and no time. A population is all the individuals of one species in a defined area at a defined time, and without a boundary there is no way to decide which individuals count, nor any basis for comparing one count with a later one. Stating the boundary also defines what counts as movement in or out.
Part 2 · Four pathways, and only four
Individuals enter a population by being born in it or by moving into it, and leave by dying or by moving out. Births, immigration, deaths, emigration — every change in a count is the net effect of these four. Writing them as a sum makes any population change calculable: ending count equals starting count, plus births, plus immigration, minus deaths, minus emigration.
Run the model. A population starts at 50. Births add 12 and immigration adds 5, giving 17 added. Deaths remove 8 and emigration removes 4, giving 12 removed. The ending count is 50 + 17 − 12 = 55, a net increase of five.
The arithmetic is easy and the interpretive point is not. A net increase of five is consistent with many different combinations: 12 births and 8 deaths, or 30 births and 26 deaths, or no births at all and heavy immigration. The net change tells you nothing about which pathways were active, and populations with the same net change can be in completely different conditions.
Pause and explain
A population starts at 50; births add 12, immigration adds 5, deaths remove 8, emigration removes 4. What is the ending count?
Check your reasoning after answering
Fifty-five. Additions total 12 + 5 = 17 and removals total 8 + 4 = 12, so the net change is +5 and the population ends at 50 + 17 − 12 = 55. The same net increase of five could arise from many other combinations of the four pathways, which is why the net alone says little about what is happening.
Part 3 · What limits a population
Resources limit numbers, and which resource bites first depends on the species and the place. Food, water, space to nest or root, light for plants. Abiotic conditions limit too — a population can be held well below what the food would support by temperature or by a lack of suitable soil. The limiting factor is whichever runs short first, and it can change with the season.
As numbers rise towards the carrying capacity, several things usually happen at once. Competition for the limiting resource intensifies, so individuals get less; disease spreads more easily at higher density; and predators may concentrate where prey is abundant. Each of these tends to reduce births or increase deaths, which is a negative feedback of the kind the homeostasis unit described, operating on a population instead of a body.
Overshoot happens when a population grows past what the environment can sustain, which is possible when the limiting resource can be consumed faster than it is replaced. The St Matthew reindeer ate lichen that regrows over decades, so the damage outlasted the population that did it. A carrying capacity is therefore not a fixed ceiling a population bumps against — it is a property of the environment that the population itself can change.
Pause and explain
How can a population exceed its carrying capacity if the environment cannot support it?
Check your reasoning after answering
Because a resource can be consumed faster than it is replaced. A population can live for a time on an accumulated store — lichen built up over centuries, for example — growing past what the environment can sustain in the long run. The correction comes later and can be severe, and the damage to the resource may outlast the population.
Part 4 · Why before-and-after counts tell you less than they seem to
Count a population in April and again in September and you have two numbers and a difference. What you do not have is any information about which of the four pathways produced it. A fall of twenty could be twenty deaths, or twenty animals moving to the next valley, or fifty births and seventy deaths. Each would call for a completely different explanation and response.
Separating them requires different evidence. Marking individuals lets you distinguish movement from death, since a marked animal found elsewhere emigrated rather than died. Counting nests or young gives a birth rate directly. Surveying a wider area catches animals that merely moved. Each pathway needs its own measurement; none can be inferred from the net.
That is the honest conclusion to this chapter. A number is a starting point, and the question to ask of any population figure is what it was measured over, what boundary it used, and which of the four pathways it can distinguish. The sampling unit in the next chapter takes up the further problem that most of these counts are estimates in the first place.
Pause and explain
A field's rabbit count falls from 60 to 40. Name two different explanations and the evidence that would distinguish them.
Check your reasoning after answering
Twenty rabbits could have died, or twenty could have moved to neighbouring land, or births and deaths could both have been high with deaths exceeding births. Marking individuals would distinguish movement from death, since a marked rabbit found elsewhere emigrated; counting young or nests would establish the birth rate; surveying surrounding land would find emigrants.
Apply the whole unit · Balance a population model
Illustrative interval, not surveyed data: a population begins at 50; births add 12; immigration adds 5; deaths remove 8; emigration removes 4. No other pathways are stipulated.
Your task
Calculate the ending count, and explain why a before-and-after count on its own could not have identified the pathways involved.
What your response should show
- Explain the relevant biological process accurately.
- Use the supplied evidence and show calculation steps with units where needed.
- Connect a labeled model or mechanism with the claim.
- State an assumption, evidence limitation, or useful next observation.
Response guidance — after your attempt
Total the additions: 12 births + 5 immigrants = 17 individuals added.
Total the removals: 8 deaths + 4 emigrants = 12 individuals removed.
Calculate the ending count: 50 + 17 − 12 = 55, a net increase of five.
Explain the limitation: the same net increase of five is consistent with many combinations of the four pathways, so the net cannot identify which were active.
The population ends at 55. Additions are 12 births and 5 immigrants, totalling 17; removals are 8 deaths and 4 emigrants, totalling 12; so the ending count is 50 + 17 − 12 = 55, a net increase of five over the interval. The reason a before-and-after count could not have produced this account is that it would have given only the net figure. A rise from 50 to 55 is equally consistent with 5 births and no other activity, with 40 births and 35 deaths, or with no births at all and heavy immigration from neighbouring land — and those describe completely different situations. A population with high births and high deaths is under very different pressure from one that is simply drifting upward, and only the first would be worth investigating for disease or resource shortage. Distinguishing the pathways needs evidence aimed at each one. Marking individuals separates movement from death, since a marked animal recorded elsewhere emigrated rather than died. Counting nests, eggs or young gives a birth rate directly. Surveying the surrounding area finds emigrants and identifies where immigrants came from. Each pathway needs its own measurement, and none can be inferred from the net change. Two further limits apply to this model: it stipulates that no other pathways exist, where a real study would have to argue for that, and it gives no interval length, without which none of these figures can be turned into a rate.
Scientific references for this unit
Parent / teacher teaching notes
Ask for a because-statement and a labeled relationship, not just a memorized word. Work through one calculation step at a time, permit oral or diagram responses, and use flexible sessions for difficult reading. Compare the learner’s actual evidence with the supplied model; do not reward copying or agreement with a personal preference. No private family, genetic, or medical records are required.
The key idea
A population includes individuals of the same species in a defined area and interval. A community includes populations of different species. A habitat is the setting supplying conditions and resources for an organism. Biotic factors involve organisms; abiotic factors include physical conditions such as water, light, and temperature.
Worked examples
Example 1 · Work backwards to a missing pathway
- Calculate the net change: 74 − 80 = −6 individuals over the interval.
- Total the known additions and the known removal: +10 births, +2 immigrants, −9 deaths gives +3 so far.
- Find the remaining removal: the net is −6, so emigration must account for 3 − (−6) = 9 individuals.
A balance can find a missing pathway, but only if you have genuinely listed all the others.
Example 2 · Judge a conclusion about a decline
- Identify what the survey measured: a difference between two counts, which is a net change.
- List the pathways that could produce it: deaths, emigration, or reduced births alongside ordinary deaths — any combination netting to −30.
- Ask what evidence would support the specific claim: bodies found, a measured pollutant, comparison with similar unaffected ponds, and a check of neighbouring water for emigrants.
A net change names no pathway and no cause. Both need their own evidence.
Avoid these mistakes
- Mistake: a population is all the members of a species. It is those in a defined area at a defined time; without a boundary and a date the count cannot be compared with anything.
- Mistake: a falling count means deaths. Emigration and reduced births produce the same net change, and distinguishing them needs marking, nest counts or a wider survey.
- Mistake: carrying capacity is a fixed ceiling. A population can overshoot by consuming a resource faster than it regrows, as the St Matthew reindeer did, and damage the capacity itself.
- Mistake: the net change describes what happened. A rise of five could be 5 births or 40 births and 35 deaths; those are very different situations with the same net.
Check your understanding
Why should a count include area and effort?
Discuss the answer
Without them, equal or different counts might reflect different survey scope rather than biological change.
Does an increased count prove more births?
Discuss the answer
No. Immigration or detection differences can also increase the recorded number.
Words to know
- population
- All the individuals of one species in a defined area at a defined time; both the boundary and the date are part of the definition.
- community
- All the populations of different species living in the same area, interacting with each other.
- biotic factor
- A living influence on a population — food, predators, disease, competitors.
- abiotic factor
- A non-living influence — temperature, water, light, soil, space — which can hold a population well below what its food supply would allow.
- carrying capacity
- The number an environment can sustain given its resources; not a fixed ceiling, since a population can overshoot it and damage the resource.
Extend your scientific explanation
Compare a second supplied example or the linked educational reference. Identify a connection, a model limit, and an additional observation that would test the explanation.
In the real world
Use a clear question, reliable observations, and a biological mechanism to evaluate a claim. State what remains uncertain before applying a classroom model to a different setting.
Exit check
Why might a lower observed count not mean the same number died?
Check your explanation after answering
Movement or lower detectability can affect counts; births and deaths are not the only pathways.
Explain your reasoning without notes. If a key idea is missing, revisit the lesson and try again.
Problem 1
Answer and explanation
The insect decline can affect the mouse pathway and indirectly foxes, but mice also have seeds and foxes also have rabbits. The web does not give dependence strengths, alternative resource changes, movement, or timing. It supports a conditional mechanism, not an exact population forecast.
Follow insect→mouse→fox under the stated arrows.
Identify seeds as another mouse resource and rabbits as another fox resource.
Request counts, rates, and interval information.
Response criteria
- Explain the relevant biological process accurately.
- Use the supplied evidence and show calculation steps with units where needed.
- Connect a labeled model or mechanism with the claim.
- State an assumption, evidence limitation, or useful next observation.
Problem 2
Answer and explanation
It obtains and transfers organic matter and energy from dead material and wastes within connected pathways.
Problem 3
Answer and explanation
The two modeled transfers are 15% and 20%. They are not both ten percent. Lower energy reaching the next position does not mean energy was destroyed; organisms use energy and transfer it into other pathways and heat. The model does not give the full separate budget or exact organism counts.
300/2,000×100=15%.
60/300×100=20%.
Identify other energy pathways and the stated boundary.
Response criteria
- Explain the relevant biological process accurately.
- Use the supplied evidence and show calculation steps with units where needed.
- Connect a labeled model or mechanism with the claim.
- State an assumption, evidence limitation, or useful next observation.
Problem 4
Answer and explanation
Individual count differs from energy amount; organisms vary greatly in size and available energy.
Problem 5
Answer and explanation
The modeled pond gains 20 L. Rain and runoff are inputs, while evaporation and outflow cross outward. The changing pond amount is consistent with matter conservation because the pond is only one boundary. The result assumes the stated pathways are complete for the interval and does not predict future weather or every real pond exchange.
Inputs: 40+20=60 L.
Outputs: 25+15=40 L.
Change: 60−40=+20 L.
Response criteria
- Explain the relevant biological process accurately.
- Use the supplied evidence and show calculation steps with units where needed.
- Connect a labeled model or mechanism with the claim.
- State an assumption, evidence limitation, or useful next observation.
Problem 6
Answer and explanation
No. Carbon dioxide supplies carbon matter in the plant model; light supplies energy.
Problem 7
Answer and explanation
A shows 6 g loss and B 2 g, so A lost 4 g more in this illustrative comparison. This is consistent with a treatment-related decomposition question under the stated matching. It does not identify every organism or destination of matter. Check replication, dry-mass method, and material transfers before generalizing to every soil.
A loss: 20−14=6 g.
B loss: 20−18=2 g.
Compare dry-mass method and missing destinations.
Response criteria
- Explain the relevant biological process accurately.
- Use the supplied evidence and show calculation steps with units where needed.
- Connect a labeled model or mechanism with the claim.
- State an assumption, evidence limitation, or useful next observation.
Problem 8
Answer and explanation
They can hold air and water and affect movement and root conditions, rather than being biologically meaningless empty areas.
Problem 9
Answer and explanation
The modeled population ends at 55, a net increase of five. The same net change could result from other combinations of births, deaths, and movement. Before-after counts alone do not identify the mechanism; pathway observations, boundaries, and detection methods are needed. This model does not establish a permanent habitat capacity.
Gains: 12+5=17.
Losses: 8+4=12.
End: 50+17−12=55.
Response criteria
- Explain the relevant biological process accurately.
- Use the supplied evidence and show calculation steps with units where needed.
- Connect a labeled model or mechanism with the claim.
- State an assumption, evidence limitation, or useful next observation.
Problem 10
Answer and explanation
Without them, equal or different counts might reflect different survey scope rather than biological change.