Tables, Graphs & Patterns in Data — Print · Grade 7 Science
Chapter: Scientific Inquiry & Diversity of LifeTables, Graphs & Patterns in Data
Learning goals
- I can explain tables, graphs & patterns in data.
- I can use evidence, a model, and stated assumptions to support a biological explanation.
Before this unit
Use the supplied vocabulary, distinguish an observation from an explanation, and identify any units or model assumptions. Revisit a connected earlier unit if needed; new terms are explained here.
Use three flexible 40–45-minute sessions: core background and Parts 1–2 with their checks; Parts 3–4 and the worked application; then remaining practice, a labeled model, revision, and the exit check. Checks completed during reading can count toward the practice set. Read one short part at a time. Investigations and chapter review/quiz have separate sessions, and flexible weeks allow more time.
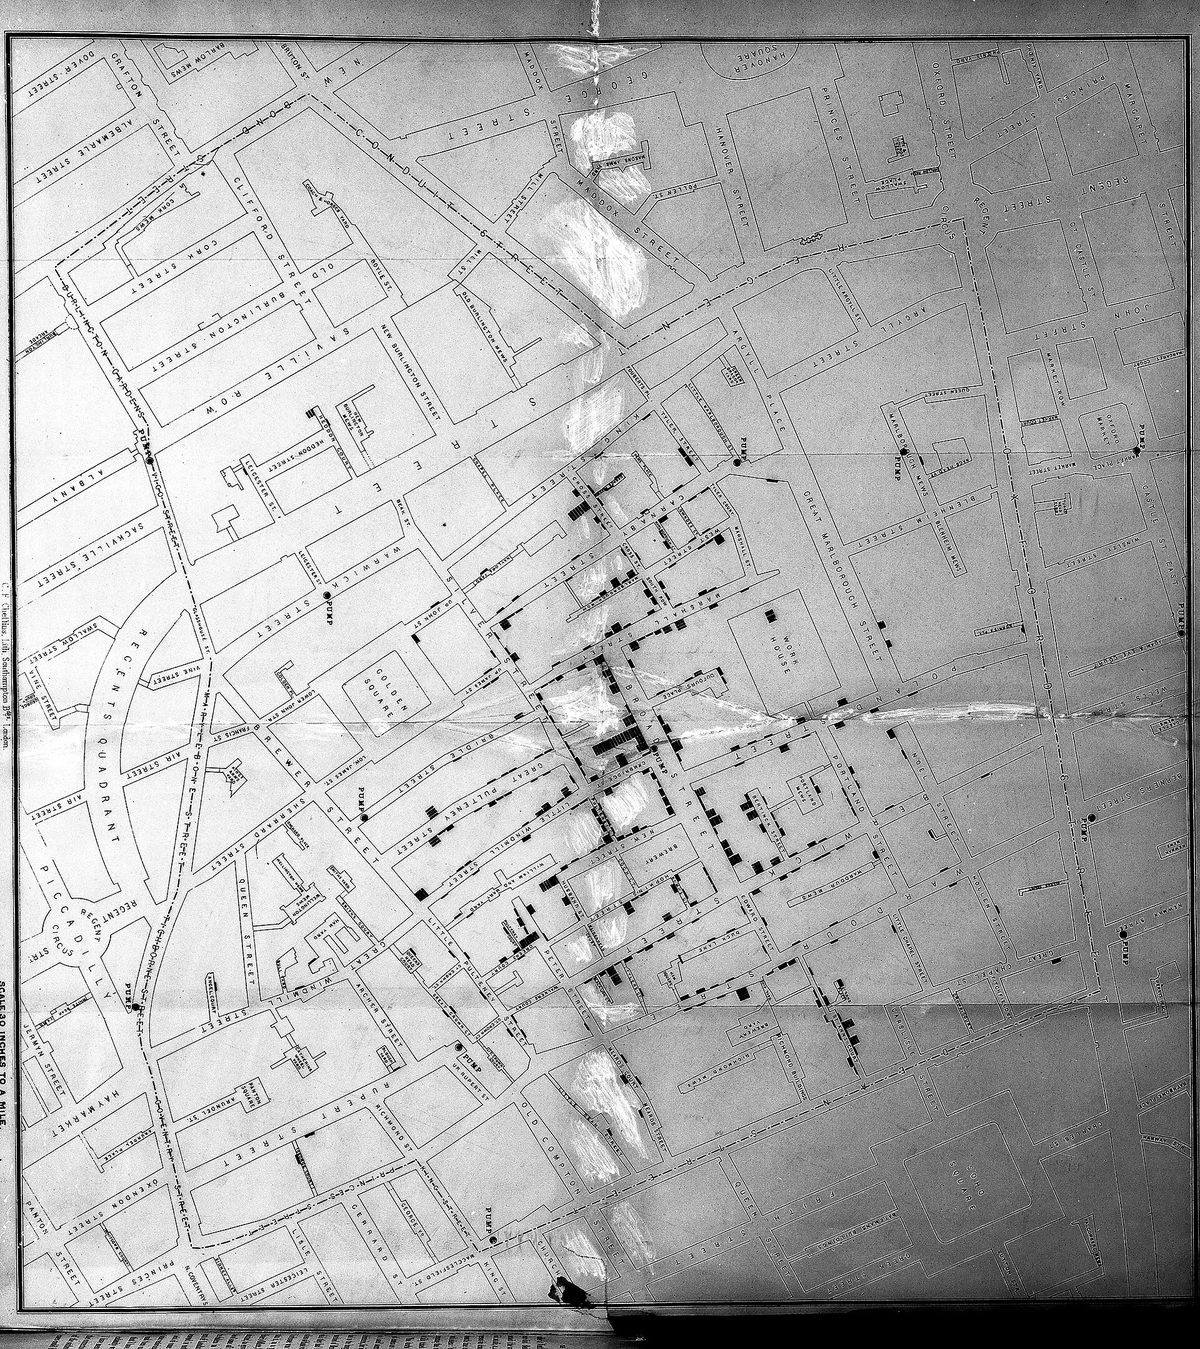
In the late summer of 1854, a cholera outbreak in Soho killed more than five hundred people in ten days. The accepted explanation was bad air. A doctor named John Snow did something different: he went door to door, recorded where each death had occurred, and drew them on a street map as small black bars. The map made a pattern visible that no list of names could — the deaths clustered tightly around one water pump in Broad Street, and thinned out with distance from it. The cases that did not fit turned out to confirm it. A nearby workhouse with its own well had almost no deaths. A brewery, where the workers drank beer, had none. Snow's map is the best demonstration there is of what organising data well can do: the numbers were available to everyone, and arranging them revealed something nobody had seen.
Most of the time you will be working with far smaller sets, and the first job is a table you or anyone else can check. Every column needs a heading with a unit, every row needs to be identifiable, and every measurement goes in — including the odd ones. Then you summarise. The mean is the familiar one: add the values and divide by how many there are. The range is the distance from the lowest to the highest, and it is the one people skip, which is a mistake, because a mean on its own hides everything about how spread out the measurements were.
Two numbers with the same mean can describe quite different situations, which is why both matter. The pattern you then describe has to be stated carefully. When two things change together, that is a correlation, and a correlation is a genuine finding that does not by itself establish that one caused the other — a third factor may drive both. And predicting beyond the range of your data is extrapolation, which is always a guess: seedlings given more water grow taller up to a point, and then drown, and no amount of data from the rising part of that curve warns you about the fall.
Build your understanding
Where this fits
You can now design a fair comparison and measure it honestly. That produces numbers, and numbers do not interpret themselves. This unit is about getting a pattern out of a set of measurements without reading in more than is there — which is the last tool you need before the final unit of the chapter puts claim, evidence and reasoning together.
Use three flexible 40–45-minute sessions: core background and Parts 1–2 with their checks; Parts 3–4 and the worked application; then remaining practice, a labeled model, revision, and the exit check. Checks completed during reading can count toward the practice set. Read one short part at a time. Investigations and chapter review/quiz have separate sessions, and flexible weeks allow more time.
Part 1 · A table somebody else could check
A good table is a record, not a summary. Each column gets a heading naming the quantity and its unit — "height gain / cm", not "height" — so nobody has to guess later. Each row identifies what was measured: plant 1, plant 2, and so on, rather than an anonymous list. Readings go in as they were taken, to the same number of decimal places, in the order they were taken.
Keep the raw measurements separate from anything calculated. If you work out means, put them in their own row or column clearly labelled, so a reader can check your arithmetic against the original numbers. A table where the raw values have been replaced by averages cannot be audited, and cannot be reanalysed if you later think of a better question.
Record the awkward entries too, with a note. "Plant 7: knocked over on day 4, not measured" is useful information. So is "plant 3: 11 cm — much larger than the others, grown from a visibly bigger seed". Those notes are what let you decide honestly later whether a value belongs in the analysis, instead of deciding it silently while you type.
Pause and explain
Why should raw measurements stay in the table even after you have calculated a mean?
Check your reasoning after answering
Because the mean cannot be checked or reinterpreted without them. Raw values let a reader verify the arithmetic, see how spread out the measurements were, spot an unusual reading, and recalculate if a better question comes up later. A table showing only averages is a conclusion, not a record.
Part 2 · Choosing axes and a scale that does not mislead
Put the thing you changed on the horizontal axis and the thing you measured on the vertical one — independent across the bottom, dependent up the side. Label both with quantity and unit. Then choose the scale: equal intervals all the way along, with the divisions sensible numbers, and the axis starting at zero unless there is a stated reason not to.
That last point is where graphs most often mislead, usually without anyone intending it. Plot heights of 4.0 cm and 4.5 cm on an axis running from 3.9 to 4.6 and one bar looks several times the other; plot the same values from zero and the difference looks like what it is, about a tenth. Neither graph lies about the numbers, but they leave very different impressions, so a truncated axis has to be marked clearly.
Pick the form that fits the data. Separate categories — treatment A against treatment B — call for a bar chart with gaps between the bars. A measured quantity changing continuously, such as height against day, calls for points plotted and, if there is a clear trend, a line of best fit drawn through them rather than a zigzag joining every dot.
Pause and explain
Two bars show 4.0 cm and 4.5 cm on an axis that starts at 3.9 cm. Why might a reader be misled?
Check your reasoning after answering
Because the visible part of each bar shows only the amount above 3.9 cm, so one bar appears several times taller than the other when the real difference is about one eighth. The numbers are correct and the impression is wrong. An axis starting at zero shows the true proportion, and a truncated axis must be clearly marked as one.
Part 3 · A summary that keeps the variation
Work an example. Treatment A produces height gains of 3, 4 and 5 cm; treatment B produces 1, 4 and 7 cm. Both means are 4 cm: A gives 12 ÷ 3 and so does B. If you reported only the means you would conclude the treatments performed identically. They did not. A's range is 5 − 3 = 2 cm, while B's is 7 − 1 = 6 cm, three times as wide.
That difference matters for what you can claim. A's plants behaved consistently, so a repeat would probably land near 4 cm again. B's results varied so much that the next plant could plausibly come in anywhere between 1 and 7, and its mean of 4 is not telling you much about any individual plant. The spread is information about how reliable the average is.
So report a mean with a range beside it, always. "4 cm (range 2 cm)" and "4 cm (range 6 cm)" are different findings, and only the pair of numbers distinguishes them. With small sets like these the range is the right measure; with larger sets scientists use more sophisticated measures of spread, but they are doing the same job.
Pause and explain
Two treatments both give a mean of 4 cm, with ranges of 2 cm and 6 cm. What does that tell you?
Check your reasoning after answering
That the averages agree while the consistency does not. The treatment with a 2 cm range produced similar results each time, so its mean describes its plants well. The one with a 6 cm range produced scattered results, so its mean of 4 cm tells you little about any individual plant and a repeat could easily give a different average.
Part 4 · Describing a pattern without overreaching
Two traps sit at the end of every analysis. The first is treating a correlation as a cause. Ice cream sales and drowning deaths rise together across a year, and neither causes the other — hot weather drives both. A correlation is worth reporting and worth investigating, and establishing a cause needs something more: a mechanism that explains how one would produce the other, and ideally a controlled comparison that changes one and watches the other.
The second is extrapolation — reading the pattern beyond the data you have. If seedlings given 5, 10 and 15 mL of water a day gained steadily more height, it does not follow that 100 mL would do better still, and in fact it would drown them. Your line describes the range you measured. Beyond it you are guessing, and the guess is least reliable exactly where the pattern is most likely to change.
The safe form of words names the range and the conditions. "Across 5 to 15 mL a day, more water was associated with more height gain in these ten seedlings over fourteen days" states what was found, where it holds, and leaves the question of larger volumes open — which is honest, because it is open.
Pause and explain
Why is a correlation between two measurements not enough to claim one causes the other?
Check your reasoning after answering
Because a third factor can drive both, as hot weather drives both ice cream sales and swimming deaths, and because the causation could run the other way. A causal claim needs a mechanism explaining how one would produce the other, and ideally a controlled comparison in which only the suspected cause is changed.
Apply the whole unit · Compare repeated height measurements
Illustrative records, not a measured experiment: under the same stated conditions and interval, treatment A produced height gains of 3, 4 and 5 cm, and treatment B produced 1, 4 and 7 cm.
Your task
Calculate the mean and the range for each treatment, then describe one way they are alike, one way they differ, and what these summaries cannot establish.
What your response should show
- Explain the relevant biological process accurately.
- Use the supplied evidence and show calculation steps with units where needed.
- Connect a labeled model or mechanism with the claim.
- State an assumption, evidence limitation, or useful next observation.
Response guidance — after your attempt
Mean of A: (3 + 4 + 5) ÷ 3 = 12 ÷ 3 = 4 cm. Mean of B: (1 + 4 + 7) ÷ 3 = 12 ÷ 3 = 4 cm.
Range of A: 5 − 3 = 2 cm. Range of B: 7 − 1 = 6 cm, three times as wide.
State the likeness and the difference: the averages are identical, while B's results are far more spread out than A's.
State the limits: three plants per treatment is a very small set, and nothing here explains why B varied more or whether the pattern would hold again.
Both treatments have a mean of 4 cm: A gives (3 + 4 + 5) ÷ 3 = 4 and B gives (1 + 4 + 7) ÷ 3 = 4. They are alike in their averages and quite unlike in their spread. A's range is 5 − 3 = 2 cm; B's is 7 − 1 = 6 cm, three times as wide. That difference changes what each mean is worth. A's plants behaved consistently, so 4 cm describes them well and a repeat would probably land near it. B's results scattered from 1 to 7 cm, so its mean of 4 cm describes no individual plant particularly and the next result could fall anywhere across that span. Reporting only the means would have hidden this entirely, which is why a mean should always travel with a measure of spread. What the summaries cannot establish is anything about cause. Three plants per treatment is a very small set, and the records do not say why B varied more — it could be uneven seed quality, uneven watering, differences in position, or chance. Nor can they support a prediction outside the conditions that were run. The useful next step would be more plants per treatment and a record of the conditions each one experienced, so that the source of B's variability can be looked for rather than guessed at.
Scientific references for this unit
Parent / teacher teaching notes
Ask for a because-statement and a labeled relationship, not just a memorized word. Work through one calculation step at a time, permit oral or diagram responses, and use flexible sessions for difficult reading. Compare the learner’s actual evidence with the supplied model; do not reward copying or agreement with a personal preference. No private family, genetic, or medical records are required.
The key idea
Data are recorded observations or measurements. A table preserves individual values, conditions, and units; a graph helps display relationships. Selecting a graph depends on the question. A line graph can show change over an ordered time sequence, while a bar graph compares separate categories. A graph makes a pattern easier to see but does not create evidence that was not measured.
Worked examples
Example 1 · Read what a map of data shows
- Identify the pattern: death density falls with distance from one pump, and two groups who did not use that pump were spared.
- Note why the exceptions strengthen it: the workhouse and brewery are cases where the suspected exposure was absent and the outcome was absent too.
- State the limit: the map shows an association between using one water source and dying, not the agent or the mechanism, which Snow could not identify.
The cases that break a pattern are often the most informative, because they test it.
Example 2 · Decide what a mean is hiding
- Calculate both means: X gives 20 ÷ 5 = 4 cm; Y gives 20 ÷ 5 = 4 cm.
- Calculate both ranges: X is 4 − 4 = 0 cm; Y is 8 − 0 = 8 cm.
- Compare what each tells you about an individual: X's plants all did the same thing, Y's did eight different things averaging to the same figure.
Never report a mean alone. The spread is half the result.
Avoid these mistakes
- Mistake: the mean is the result. Treatments A and B above both average 4 cm with ranges of 2 cm and 6 cm, which are quite different findings; a mean without a spread hides that.
- Mistake: correlation shows cause. Ice cream sales and drowning rise together because hot weather drives both; a causal claim needs a mechanism and a controlled comparison.
- Mistake: the line can be read past the data. Seedlings given 5 to 15 mL gained steadily more height, and 100 mL would drown them — extrapolation is guessing where the pattern is most likely to change.
- Mistake: a truncated axis is harmless. Bars of 4.0 and 4.5 cm drawn from 3.9 cm look several times different when the real gap is about an eighth; mark the break clearly or start at zero.
Check your understanding
Why is a missing measurement not automatically zero?
Discuss the answer
Missing means no valid observation was recorded. Zero claims that the measured quantity was actually zero.
How can uneven time spacing mislead a reader?
Discuss the answer
It can make the same change appear faster or slower because equal horizontal distances no longer represent equal times.
Words to know
- data
- The recorded measurements and observations themselves, kept raw so that any summary drawn from them can be checked.
- mean
- The sum of the values divided by how many there are; it should always be reported with a measure of spread beside it.
- range
- The distance from the lowest value to the highest, which shows how consistent a set of measurements was.
- correlation
- Two quantities changing together — a real finding, but not on its own evidence that one causes the other.
- extrapolation
- Predicting beyond the range of the data collected; always a guess, and least reliable where the pattern is most likely to change.
Extend your scientific explanation
Compare a second supplied example or the linked educational reference. Identify a connection, a model limit, and an additional observation that would test the explanation.
In the real world
Use a clear question, reliable observations, and a biological mechanism to evaluate a claim. State what remains uncertain before applying a classroom model to a different setting.
Exit check
Why is extending a seven-day growth line to a year uncertain?
Check your explanation after answering
The extension assumes the same growth rate and conditions far beyond the measured interval; resource limits and development can change the pattern.
Explain your reasoning without notes. If a key idea is missing, revisit the lesson and try again.
Problem 1
Answer and explanation
Missing means no valid observation was recorded. Zero claims that the measured quantity was actually zero.
Problem 2
Answer and explanation
It can make the same change appear faster or slower because equal horizontal distances no longer represent equal times.
Problem 3
Answer and explanation
No. Different combinations of measurements can average 5 cm. Inspect the original values and their spread.
Problem 4
Answer and explanation
The extension assumes the same growth rate and conditions far beyond the measured interval; resource limits and development can change the pattern.
Problem 5
Answer and explanation
Both means are 4 cm. A’s numerical range is 2 cm; B’s is 6 cm. The means agree but B’s observations are more spread out. These small illustrative sets do not establish why variability differs or whether a treatment caused the pattern. Keep individual records, examine methods, and use more independent observations.
A sum is 12 cm and B sum is 12 cm.
Divide each by three.
Subtract smallest from largest in each set.
Compare spread without inventing a cause.
Response criteria
- Explain the relevant biological process accurately.
- Use the supplied evidence and show calculation steps with units where needed.
- Connect a labeled model or mechanism with the claim.
- State an assumption, evidence limitation, or useful next observation.
Problem 6
Answer and explanation
No. Other conditions such as soil, species, light, and initial size may differ. A causal explanation needs a plausible mechanism and comparisons addressing alternatives.
Response criteria
- Explain the relevant biological process accurately.
- Use the supplied evidence and show calculation steps with units where needed.
- Connect a labeled model or mechanism with the claim.
- State an assumption, evidence limitation, or useful next observation.
Problem 7
- A bar graph
- A drawing without labels
- A graph with changing scale intervals
- A pie chart with no totals
Answer and explanation
A bar graph
Bars can compare separate habitat categories when units and sampling effort are comparable.
Problem 8
Answer and explanation
5 cm
(2+4+9)/3=15/3=5 cm.