Populations & Communities — Practice · Grade 10 Science
Chapter: Ecosystems & Conservation DecisionsWhat this practice covers
By the end of Populations & Communities you should be able to:
- I can distinguish exponential from logistic population growth and explain what causes the difference.
- I can explain how limiting factors set an ecosystem's carrying capacity, and identify the main ways species interact.
11 questions, multiple choice, numeric and written answer, each with a worked explanation.
Vocabulary used: population, exponential growth, logistic growth, carrying capacity, limiting factor, symbiosis.
Problem 1
- community
- biome
- trophic level
- population
Answer and explanation
population
A population is one species in one area; a community is all the different populations together.
Problem 2
Answer and explanation
3200 cells
N = 200 × 2⁴ = 200 × 16 = 3,200 cells.
Problem 3
- the carrying capacity
- twice the carrying capacity
- an ever-increasing value
- zero
Answer and explanation
the carrying capacity
Logistic growth flattens out at the carrying capacity (K), where birth and death rates roughly balance.
Problem 4
- commensalism
- parasitism
- competition
- mutualism
Answer and explanation
parasitism
In parasitism one species benefits (the tapeworm) at the direct expense of the other (the dog).
Problem 5
Answer and explanation
A density-dependent limiting factor grows stronger as a population becomes more crowded — for example, competition for food, disease, or predation. A density-independent limiting factor affects a population regardless of its density — for example, a hard freeze, a flood, or a wildfire. Density-dependent factors tend to pull a population back toward its carrying capacity, while density-independent factors can strike no matter how sparse or crowded the population is.
Problem 6
Answer and explanation
215 individuals under the stated accounting.
Net change=30+10−20−5=15.
New size=200+15=215.
Response criteria
- Use the stated conditions.
- Show the evidence or calculation.
- Explain the conclusion and any stated limitation.
Problem 7
Hints
Include both migration flows, not just births and deaths.
Answer and explanation
−15 individuals.
Problem 8
Hints
State what the supplied observations or conditions establish, and separate that from any assumption.
Answer and explanation
Transmission may increase with crowding, while a storm can affect populations regardless of density, depending on the event.
Problem 9
Answer and explanation
More individuals can experience the same per-individual risk; density dependence concerns how that risk or effect changes with density.
A density-dependent effect changes per-individual impact with density, as selected competition or infection processes can. A density-independent event can affect abundance without that same dependence, though its final consequences still interact with conditions. A storm killing organisms does not automatically create feedback that restores a fixed population. Define the per-individual effect and compare densities under matched conditions. Changes in total losses can occur simply because more individuals are exposed even when the per-individual rate is unchanged.
More individuals can experience the same per-individual risk; density dependence concerns how that risk or effect changes with density.
Response criteria
- Read the structures, axes, directions and units correctly.
- Connect the evidence with the biological mechanism.
- Respect stated model assumptions and distinguish an observation from a further inference.
Problem 10
Answer and explanation
Final count is 80+20−12+9−5 = 92. Change is +12, or 12/80×100 = 15%, under the stated boundary and interval.
Final count is 80+20−12+9−5 = 92. Change is +12, or 12/80×100 = 15%, under the stated boundary and interval.
Response criteria
- Use the stated measurements or conditions, with correct units.
- Connect the result to the biological mechanism or evidence relationship.
- Identify the assumption, model limit or further evidence requested.
Problem 11
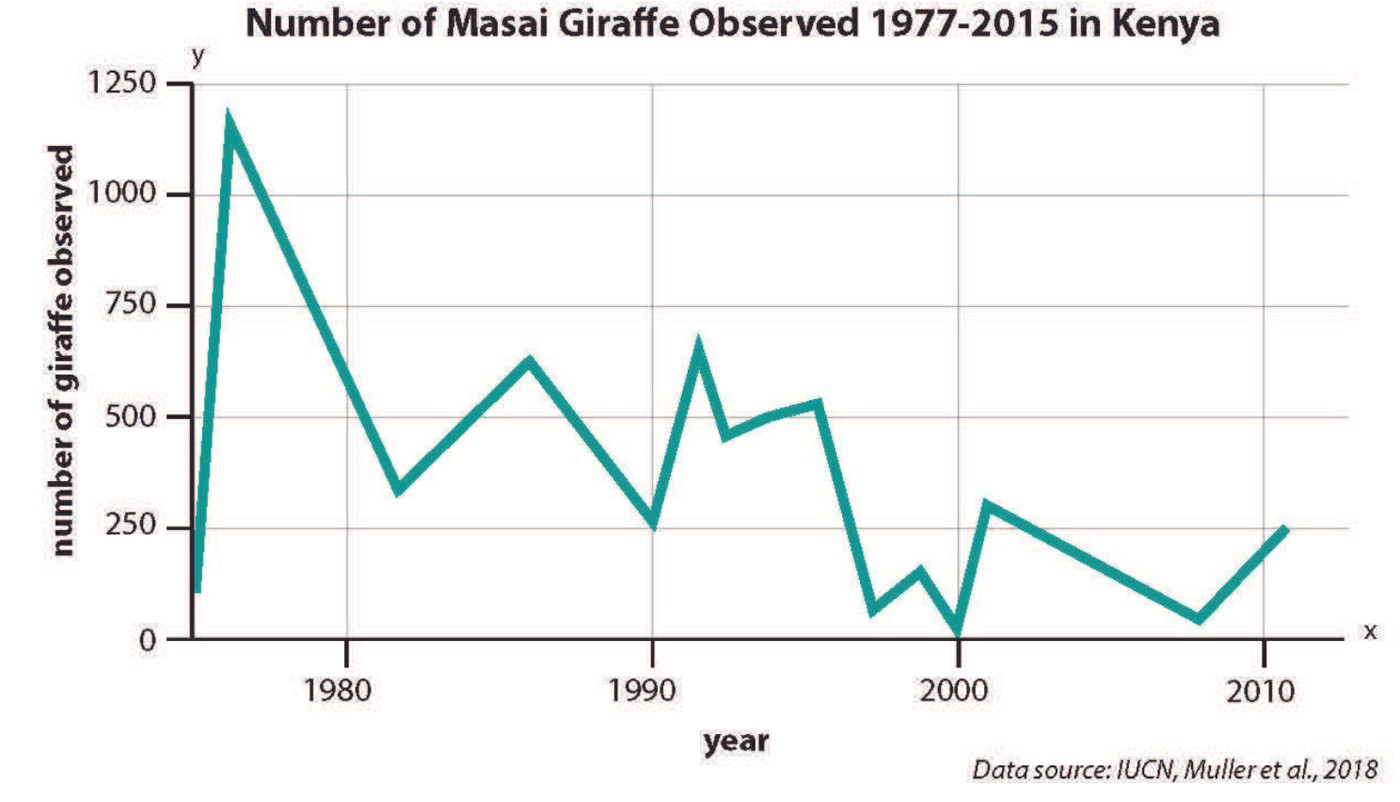
Answer and explanation
The high early peak exceeds 1,000 observed giraffes, while most later plotted counts are much lower. The record is not monotonic: a valid rise occurs just after the very low count near 2000. Trend descriptions depend on the chosen endpoints, so the early peak-to-later decline is not a claim that every possible interval declines. Neither a rise nor a decline isolates causality. Comparable survey area/effort, detection methods, dates/season and habitat or population movement information help interpret the counts.
Read the named organism, region, years and count axis.
Compare both a long interval and a specific rising segment rather than choose one convenient section.
Request sampling/detection and biological context before assigning a cause.
Response criteria
- Compare the high early peak with later values, identify a rising segment and explain why endpoint choice matters.
- Retain the organism/region/interval and observed-count meaning.
- State two relevant monitoring details and a causal limitation.