Populations & Communities — Print · Grade 10 Science
Chapter: Ecosystems & Conservation DecisionsPopulations & Communities
Learning goals
- I can distinguish exponential from logistic population growth and explain what causes the difference.
- I can explain how limiting factors set an ecosystem's carrying capacity, and identify the main ways species interact.
Readings for this unit
Before this unit
Distinguish population, community and ecosystem.
Use three flexible study sessions: core explanation and Parts 1–2; Parts 3–4 with their reasoning checks and models; then the whole-unit application, worked examples, independent practice, and exit check. Allow about 50–60 minutes per session, including diagrams, data work, and notebook explanations. Attempt each check before opening its guidance. Schedule chapter investigations, review, and exams separately; add time where prerequisites are uncertain. Trace the explained visual parts and write a first model, then attempt the illustrated and changed independent cases. In the third session explain a correction and revise the opening account using evidence.
Start with something to explain
Why can a population rise without a higher birth rate?
Illustrative evidence case. Births, deaths and crossing the boundary contribute separately; resource and interaction conditions can change growth.
Notice and wonder
Record two observations using the stated quantities or relationships. Keep observations separate from possible causes. Write one question that a new measurement could help answer.
Why can a population rise without a higher birth rate?
Your first model
Draw the population boundary and all four count-changing flows.
Build the language from the idea
- population
- All the members of a single species living and interbreeding in the same area at the same time.
- exponential growth
- Growth in which a population increases by a constant proportion each period, producing a rapidly steepening J-shaped curve.
- logistic growth
- Growth that starts fast but slows and levels off as a population nears the limits of its environment, producing an S-shaped curve.
- carrying capacity
- The maximum population size (symbol K) that an environment can support over the long term, given its resources.
- limiting factor
- Any resource or condition — food, water, space, predators, disease, weather — that restricts how large a population can grow.
- symbiosis
- A close, long-term relationship between two different species, which may benefit both (mutualism), benefit one without affecting the other (commensalism), or benefit one at the other's expense (parasitism).
Ecology is the study of how living things interact with one another and with their surroundings, and it is built out of a few nested levels. A population is all the members of one species living together in the same place — every gray wolf in a valley, every cattail in a marsh. Zoom out and you find a *community*: all the different populations sharing that area, from the wolves and deer down to the grasses and soil bacteria. Zoom out once more and you add the nonliving surroundings — sunlight, water, soil, climate — to get an ecosystem. This first knowledge point lives at the population and community levels, asking a deceptively simple question: what decides how many individuals an area can hold?
Start with a population that has everything it needs and nothing holding it back. Under those ideal conditions a population shows exponential growth: it increases by the same *proportion* each period, so the more individuals there are, the faster new ones are added. Picture bacteria that double every hour — 1 becomes 2, 2 becomes 4, then 8, 16, 32 — a curve that starts almost flat and then rockets upward into the unmistakable J-shape. The catch is that no population can sustain this forever. Keep doubling and the numbers quickly become impossible; a single dividing bacterium would, in theory, blanket the planet in a matter of days. Something always intervenes.
What intervenes is the real world's finite supply of resources. As a population grows denser, food, water, nesting sites, and space get shared ever more thinly, and predators and diseases find easy targets in the crowd. A useful idealized model predicts an S-shaped pattern called logistic growth. Real populations need not follow that smooth curve: conditions, delays and movement can produce oscillations, overshoot or decline. The population climbs quickly at first, then decelerates, and finally levels off at a ceiling called the carrying capacity, written K. At carrying capacity the birth rate and death rate roughly balance, so the population hovers near K rather than climbing higher. Carrying capacity isn't a fixed magic number, either: a rainy year that grows extra grass can raise it, while a drought or a wildfire can lower it.
The brakes on growth are called limiting factors, and biologists sort them into two revealing kinds. Density-dependent factors bite harder as a population gets more crowded — competition for food, the spread of disease, and heavier predation all intensify when individuals are packed close together, and can slow growth without guaranteeing a return to one stable K. Density-independent factors strike regardless of how crowded things are — a hard freeze, a flood, a volcanic eruption, or a habitat-clearing storm can wipe out the same fraction of a sparse population as a dense one. Both kinds shape carrying capacity, but only density-dependent factors act like a self-correcting thermostat that can moderate growth, with strength and delays varying among systems.
Populations never grow in isolation; they are constantly pushing and pulling on the other species around them. The most familiar interaction is competition, which flares whenever organisms need the same limited resource, whether it's two hawk species hunting the same mice or seedlings racing for the same patch of sunlight. When two species compete for an identical niche, one is usually a little better at it — and over time the *competitive exclusion principle* says the weaker competitor is squeezed out of that niche entirely. A second interaction is predation, in which one organism eats another; predator and prey numbers can fluctuate with a time lag, and predator effects depend on food-web relationships and other conditions; neither cycles nor a stable community balance are guaranteed.
Not every relationship is a contest. In symbiosis, two species live in close, long-term partnership, and biologists classify these by who comes out ahead. In *mutualism* both partners benefit — think of a bee sipping nectar while ferrying a flower's pollen, or the gut bacteria that help you digest food in exchange for a warm home. In *commensalism* one species gains while the other is essentially unaffected, like barnacles hitching a ride on a whale. In *parasitism* one species profits at the other's expense, as a tapeworm or tick drains its host. Add these partnerships to competition and predation and you get a community woven together by countless threads — which is exactly why removing or adding even one species can send effects rippling far beyond it.
A population includes one species in a defined area; a community includes interacting populations. An ecosystem also includes nonliving conditions and transfers. Define the spatial boundary before comparing abundance or interactions.
Births, deaths, immigration and emigration change population size. Limiting factors can depend on density or occur independently of it. A carrying capacity is a model value that can change with resources and environmental conditions, not a permanent species-wide constant.
Competition, predation and mutualism affect organisms in context. A pairwise interaction can have indirect effects through the rest of a food web. Use repeated population evidence rather than assuming every rise or fall has one simple cause.
Build your understanding
Use three flexible study sessions: core explanation and Parts 1–2; Parts 3–4 with their reasoning checks and models; then the whole-unit application, worked examples, independent practice, and exit check. Allow about 50–60 minutes per session, including diagrams, data work, and notebook explanations. Attempt each check before opening its guidance. Schedule chapter investigations, review, and exams separately; add time where prerequisites are uncertain.
Part 1 · Populations, densities, and rates
A population contains one species within a defined boundary; a community includes interacting populations. Density is number per area or volume. Births, deaths, immigration and emigration change a count, and the boundary determines what movement is included. A percentage growth rate compares change with starting size, while an absolute change counts individuals. The plotted 10%-per-year model has increasing absolute additions; it is not a promise that real populations grow without constraints.
Read the visual model
Identify the labeled structures and units, then trace the arrows or compare values under the caption’s stated conditions. Separate the displayed evidence from a further inference. Write your reasoning before opening the guidance.
If births add 15, deaths remove 8, immigration adds 6 and emigration removes 3, what is the net change?
Visual reasoning — after your attempt
+15−8+6−3 = +10 individuals within the stated boundary.
A population is the individuals of one species in a defined area, and most ecological questions about it are quantitative: how many, how densely, and changing how fast. Density is individuals per unit area or volume, and a growth rate is a change expressed as a proportion of the starting number, which is why a rise from 120 to 150 is reported as 25 percent rather than as 30 animals.
Rates matter more than totals because they reveal direction. Two populations of 500 behave very differently if one is growing at 20 percent a year and the other shrinking at 5 percent. Estimating these numbers requires sampling — quadrats for plants, mark-recapture for mobile animals — and every estimate carries the uncertainty of its method.
Pause and explain
Why is a percentage growth rate more informative than the number of individuals added?
Check your reasoning after answering
A percentage expresses the change relative to the population's size, so it is comparable between populations of different sizes and it projects forward. Ten animals added to a population of 20 is a very different situation from ten added to 2,000.
Part 2 · Two growth patterns
Exponential growth has a constant proportional growth rate under the model; logistic growth includes a decline in proportional growth as population approaches a modeled carrying capacity. Carrying capacity depends on resources, conditions and interactions rather than a permanent property carved into a habitat. Real populations can overshoot, fluctuate, migrate or change their environment. A supplied smooth curve is a comparison of assumptions; it does not guarantee a particular stable number or prove which mechanism governs an observed record.
Read the visual model
Identify the labeled structures and units, then trace the arrows or compare values under the caption’s stated conditions. Separate the displayed evidence from a further inference. Write your reasoning before opening the guidance.
Can carrying capacity change even when the species identity stays the same?
Visual reasoning — after your attempt
Yes. Resources, habitat conditions and interacting populations can change the supported abundance under the model.
Exponential growth occurs when a population increases by a constant proportion each interval, producing an ever-steepening curve. It happens when resources are effectively unlimited — early colonization, or a population released from a constraint — and cannot continue indefinitely in a finite environment.
Logistic growth begins the same way but slows as the population approaches the carrying capacity, the number the environment's resources can sustain, and then levels off. The slowing is caused by density-dependent factors: as crowding increases, competition for food and space intensifies and disease transmits more readily. Carrying capacity is not a fixed property of a place; it changes as resources change.
Pause and explain
Why does logistic growth slow near carrying capacity while exponential growth does not?
Check your reasoning after answering
Logistic growth includes density-dependent effects: as the population rises, competition, disease, and waste accumulation increase per individual and reduce the growth rate. Exponential growth assumes those effects are absent, which is only possible while resources remain effectively unlimited.
Part 3 · Limiting factors, dependent and independent
A density-dependent effect changes per-individual impact with density, as selected competition or infection processes can. A density-independent event can affect abundance without that same dependence, though its final consequences still interact with conditions. A storm killing organisms does not automatically create feedback that restores a fixed population. Define the per-individual effect and compare densities under matched conditions. Changes in total losses can occur simply because more individuals are exposed even when the per-individual rate is unchanged.
Read the visual model
Identify the labeled structures and units, then trace the arrows or compare values under the caption’s stated conditions. Separate the displayed evidence from a further inference. Write your reasoning before opening the guidance.
Why is a larger total number lost not alone evidence of density dependence?
Visual reasoning — after your attempt
More individuals can experience the same per-individual risk; density dependence concerns how that risk or effect changes with density.
Density-dependent factors act more strongly as a population becomes denser: competition for food, territory and mates, predation that concentrates on abundant prey, and the spread of disease. These produce the feedback that stabilizes a population near carrying capacity, so they are the mechanism behind logistic growth.
Density-independent factors act regardless of population size — a frost, a flood, a fire, a storm. They can reduce a population dramatically but they do not regulate it, because their effect is unrelated to how many individuals are present. Distinguishing the two is what separates a population that is being regulated from one that is being repeatedly knocked down.
Pause and explain
Why can a density-independent factor reduce a population without regulating it?
Check your reasoning after answering
Regulation requires feedback: the factor must act more strongly when the population is large and less strongly when it is small. A frost kills a similar proportion whatever the density, so it changes numbers without pushing them toward any particular level.
Part 4 · Interactions between species
A niche describes an organism’s ecological relationships and resource use, not merely its address. Competition concerns shared limiting resources; predation involves one organism consuming another; mutualism benefits both partners under relevant conditions. Time, space and resource differences can reduce competition even within one habitat. Effects can also spread indirectly through a community. To classify an interaction, define the resource and measured outcome for each partner, and allow that the relationship may change with conditions.
Read the visual model
Identify the labeled structures and units, then trace the arrows or compare values under the caption’s stated conditions. Separate the displayed evidence from a further inference. Write your reasoning before opening the guidance.
Are two species in the same habitat necessarily strong competitors?
Visual reasoning — after your attempt
No. Different resources, timing or other conditions can limit overlap; actual effects need evidence.
Populations interact in ways that can be classified by their measured effects. In competition both species are harmed by the overlap in what they need. In predation one benefits and the other is consumed. Symbiosis covers close long-term associations: mutualism benefits both, commensalism benefits one while the other is largely unaffected, and parasitism benefits one at the other's expense.
A species' niche is the full set of conditions and resources it uses, not merely where it lives. Competition depends on niche overlap rather than on sharing a habitat, which is why two species in the same tree may coexist by feeding at different heights or times. Where overlap is near-total, one species is typically excluded unless the two diverge.
Pause and explain
Two species share a habitat but one feeds at night and the other by day on different prey. Are they strong competitors?
Check your reasoning after answering
No. Their niches overlap little, because the resources and times they use differ, and competition depends on that overlap rather than on sharing a location. They can coexist indefinitely.
Apply the whole unit · Read a population record
Illustrative annual counts of a rabbit population on an island with no predators, estimated by mark-recapture. Year 1: 40. Year 2: 78. Year 3: 152. Year 4: 290. Year 5: 480. Year 6: 610. Year 7: 660. Year 8: 655. Year 9: 648. Vegetation surveys show grass cover falling from 70 percent in year 1 to 22 percent in year 8.
Your task
Identify which growth pattern each part of the record shows, calculate the annual percentage growth between years 1 and 2 and between years 6 and 7, estimate the carrying capacity and justify the estimate, and explain which limiting factor the vegetation data implicate and whether it is density-dependent. Then state one limitation of mark-recapture estimates here.
What your response should show
- Choose the appropriate biological model or relationship and state the conditions it assumes.
- Show the counts, rates, ratios, or intermediate reasoning the question requires.
- Use the supplied evidence to justify the conclusion and separate observation from inference.
- Identify a meaningful limitation, uncertainty, or next measurement.
Response guidance — after your attempt
Years 1 to 5: counts roughly double each year early on — 40, 78, 152, 290 — which is exponential growth.
Growth rate years 1 to 2: (78 − 40) / 40 × 100 = 95 percent.
Growth rate years 6 to 7: (660 − 610) / 610 × 100 ≈ 8.2 percent, so growth has slowed sharply.
Years 7 to 9: 660, 655, 648 — the population has levelled and is drifting slightly down, so the pattern over the whole record is logistic.
Estimate carrying capacity at roughly 650 to 660 under these conditions, since that is where growth stopped; the slight decline suggests the population may have slightly overshot.
Identify the limiting factor: grass cover fell from 70 to 22 percent as the population grew, implicating food supply, and competition for food intensifies with density, so it is density-dependent.
State the limitation: mark-recapture assumes marks are not lost, marked and unmarked animals are equally catchable, and the population is closed during sampling; violations bias the estimate, and no confidence interval is given here.
The early record is exponential — 95 percent growth between years 1 and 2, with numbers roughly doubling annually to year 5 — and the later record levels off, giving a logistic pattern overall. Growth had fallen to about 8.2 percent by years 6 to 7 and to slightly negative by year 9, so carrying capacity under these conditions is about 650 to 660, with the small decline from 660 suggesting a modest overshoot. The vegetation survey implicates food: grass cover fell from 70 to 22 percent as the population rose, and competition for a shrinking food supply intensifies with density, making it a density-dependent factor and the mechanism behind the levelling. The estimates themselves should be treated with caution, since mark-recapture assumes marks persist, that marked and unmarked animals are equally likely to be caught, and that no animals enter or leave during sampling; no uncertainty range is reported, so the carrying-capacity figure is an approximation rather than a measurement.
Scientific references and adapted source figures
- OpenSciEd 7.5 — ecosystem dynamics and public case graphs
- OpenSciEd middle-school source license — CC BY 4.0
- OpenStax — population models and their environmental limits
Parent / teacher teaching notes
Insist on rates rather than differences — the percentage calculation is what makes the two growth patterns distinguishable in a table of numbers. The density-dependent against density-independent distinction is the one students most often blur, and the test question to ask is whether the factor would act differently if the population were half as large. The vegetation data are included deliberately: a population record alone cannot identify a limiting factor, and pairing it with a resource measurement is what makes the explanation evidence-based. Ask for an explanation of each label, arrow and axis before calculation. Keep first and revised models; attempt the changed case before consulting guidance. Distinguish invented instructional records from named historical sources. Source chromosome symbols are allele-category models, not DNA sequences. These independently authored high-school supplements are not the full OpenSciEd teacher editions or an endorsement.
The key idea
Births, deaths and movement change population size. Exponential and logistic curves are conditional models; real populations can fluctuate, decline or overshoot. Resources, density, disturbance and species interactions influence outcomes without guaranteeing a stable balance.
Exponential Growth (doubling)
N = N₀ × 2ⁿ
N₀ is the starting population size and n is the number of doubling periods; unlimited resources give this J-shaped curve.
Logistic Growth
growth rate = r × N × (K − N) / K
N is the current population, K is the carrying capacity, and r is the maximum growth rate; the (K − N)/K term slows growth to zero as N approaches K, producing an S-shaped curve.
Worked examples
Example 1
- Exponential doubling follows N = N₀ × 2ⁿ, where N₀ is the starting number and n is the number of doublings.
- Here N₀ = 40 and n = 3 years, so N = 40 × 2³.
- 2³ = 8, so N = 40 × 8 = 320.
Example 2 · Worked application
- Net change=60−45+20−10=25.
- Add to starting size: 500+25=525.
Include both migration flows, not just births and deaths.
Example 3
- As the population climbs toward the island's resources, each rabbit gets a smaller share of food and space, so the birth rate falls and the death rate rises.
- Exponential (J-shaped) growth slows and bends into an S-shaped logistic curve that flattens out near 500, the carrying capacity, where births roughly equal deaths.
- Density-dependent limiting factors drive this: for example, competition for a shrinking food supply and lack of space or shelter (disease spreading through the crowd would work too).
Example 4
- Net change=30+10−20−5=15.
- New size=200+15=215.
Example 5 · Find and fix the mistake
- Test the claim against the stated conditions: Include both migration flows, not just births and deaths.
- Resources, habitat and interactions change, so capacity is context-dependent.
Include both migration flows, not just births and deaths.
Example 6 · Reason from the visual evidence
- A density-dependent effect changes per-individual impact with density, as selected competition or infection processes can. A density-independent event can affect abundance without that same dependence, though its final consequences still interact with conditions. A storm killing organisms does not automatically create feedback that restores a fixed population. Define the per-individual effect and compare densities under matched conditions. Changes in total losses can occur simply because more individuals are exposed even when the per-individual rate is unchanged.
- More individuals can experience the same per-individual risk; density dependence concerns how that risk or effect changes with density.
Original selected loss-rate/density models, not universal storm or infection behavior.
Avoid these mistakes
- Carrying capacity can change and is not one fixed number for a species everywhere.
Check your understanding
A population starts at 200, gains 30 births and 10 immigrants, and loses 20 deaths and 5 emigrants. Find the new size.
Discuss the answer
215 individuals under the stated accounting.
Why should a population calculation include migration as well as births and deaths?
Discuss the answer
Immigration and emigration change the count within the boundary just as births and deaths do. Omitting them can misattribute a population change to reproduction.
Return to the phenomenon
Return to the initial case. Why can a population rise without a higher birth rate? Revise your drawing or explanation using two named ideas and one stated limitation.
Compare explanations after your attempt
A complete budget includes migration; density, percentage growth and limiting mechanisms are distinct quantities.
What should we investigate next?
Which comparison would test a remaining uncertainty? State what you would change, keep comparable and measure.
Investigate, explain and revise
Complete these tasks after the teaching parts. Preserve your first model and a supported revision; use guidance after a real attempt.
Activity 1 · Return to the opening case
Use the opening question, defined terms, Parts 1–4 and your notebook. The supplied-data route needs no equipment or external account.
Your task
Return to the initial case. Why can a population rise without a higher birth rate? Revise your drawing or explanation using two named ideas and one stated limitation.
Success criteria
- Use relevant stated observations.
- Explain the mechanism with a labeled model.
- Distinguish quantities and assumptions.
- Describe a revision and a useful next test.
Hint
Follow objects, materials and information separately. Check what each measured quantity means.
Response guidance — discuss after your attempt
A complete budget includes migration; density, percentage growth and limiting mechanisms are distinct quantities.
Activity 2 · Transfer to a changed case
Cover the worked guidance and use the unit explanations/figures to solve a changed problem.
Your task
A population starts at 80, with 20 births, 12 deaths, 9 immigrants and 5 emigrants. Find final count, change and percentage change.
Success criteria
- Use the stated measurements or conditions, with correct units.
- Connect the result to the biological mechanism or evidence relationship.
- Identify the assumption, model limit or further evidence requested.
Hint
Name the stated conditions, select the relevant mechanism and show intermediate reasoning.
Response guidance — discuss after your attempt
Final count is 80+20−12+9−5 = 92. Change is +12, or 12/80×100 = 15%, under the stated boundary and interval.
Words to know
- population
- All the members of a single species living and interbreeding in the same area at the same time.
- exponential growth
- Growth in which a population increases by a constant proportion each period, producing a rapidly steepening J-shaped curve.
- logistic growth
- Growth that starts fast but slows and levels off as a population nears the limits of its environment, producing an S-shaped curve.
- carrying capacity
- The maximum population size (symbol K) that an environment can support over the long term, given its resources.
- limiting factor
- Any resource or condition — food, water, space, predators, disease, weather — that restricts how large a population can grow.
- symbiosis
- A close, long-term relationship between two different species, which may benefit both (mutualism), benefit one without affecting the other (commensalism), or benefit one at the other's expense (parasitism).
The fur-trade ledgers that revealed predator-prey cycles
For nearly a century, the Hudson's Bay Company recorded how many snowshoe hare and Canada lynx pelts trappers brought in each year. When ecologists later plotted those numbers, a striking pattern emerged: hare and lynx populations rose and fell together in linked cycles roughly ten years long, with the lynx peak always trailing just behind the hare peak. More hares meant more food for lynx, so lynx numbers climbed; the growing lynx population then knocked the hares back down, and the lynx soon followed. It remains one of the best real-world datasets of predator-prey dynamics — captured, by accident, in accounting books.
A common trap: 'symbiosis' does not mean 'helping'
It's easy to assume symbiosis is always a friendly partnership, but the word simply means two species living in close, long-term contact — and that contact can be harmful. Mutualism (+/+) benefits both, commensalism (+/0) helps one without affecting the other, but parasitism (+/−) benefits one species at the direct expense of the other. A tapeworm and its host are just as much a symbiotic relationship as a bee and a flower. When you classify a symbiosis, always ask the same question: who benefits, and who pays?
The logistic equation, in one line
The S-curve has a tidy piece of math behind it: growth rate = r · N · (K − N) / K, where N is the current population, K is the carrying capacity, and r is the maximum growth rate. The magic is in the (K − N)/K term, a built-in brake. When N is small, that fraction is close to 1, so the population grows almost exponentially. As N climbs toward K, the fraction shrinks toward 0, throttling growth down until it stops right at carrying capacity. One expression captures both the explosive start and the gentle leveling-off.
Two life strategies: live fast or invest slow
Species tend toward one of two reproductive strategies named after that equation. r-strategists bet on quantity: they reproduce fast, produce huge numbers of offspring, and give little or no parental care — think insects, weeds, and bacteria, whose populations boom and bust. K-strategists bet on quality: they have few offspring, invest heavily in caring for each one, and their populations stay near carrying capacity — think elephants, whales, and humans. Neither strategy is 'better'; each is a different solution to the problem of surviving in a world of limited resources.
The sea star experiment that named 'keystone species'
In the 1960s, ecologist Robert Paine ran a now-famous experiment on a rocky Pacific shoreline: he repeatedly removed every predatory Pisaster sea star from a stretch of coast and watched what happened. Freed from their main predator, mussels exploded and crowded out nearly everything else, and the number of species in the area collapsed from fifteen to eight. A single predator, it turned out, had been holding the whole community's diversity together. Paine coined the term keystone species for organisms whose impact on an ecosystem is far larger than their numbers would suggest.
In the real world
Wildlife and fisheries managers estimate a species' carrying capacity to set sustainable harvest limits — catch or hunt too far below K and the population wastes resources it could use to rebound; push it far past what the habitat can support and the population can crash.
Exit check
Why can carrying capacity change?
Check your explanation after answering
Resources, conditions, species interactions, and human changes can alter what a system supports; capacity is not a permanently fixed property.
Explain your reasoning without notes. If a key idea is missing, revisit the lesson and try again.
Problem 1
- community
- biome
- trophic level
- population
Answer and explanation
population
A population is one species in one area; a community is all the different populations together.
Problem 2
Answer and explanation
3200 cells
N = 200 × 2⁴ = 200 × 16 = 3,200 cells.
Problem 3
- the carrying capacity
- twice the carrying capacity
- an ever-increasing value
- zero
Answer and explanation
the carrying capacity
Logistic growth flattens out at the carrying capacity (K), where birth and death rates roughly balance.
Problem 4
- commensalism
- parasitism
- competition
- mutualism
Answer and explanation
parasitism
In parasitism one species benefits (the tapeworm) at the direct expense of the other (the dog).
Problem 5
Answer and explanation
A density-dependent limiting factor grows stronger as a population becomes more crowded — for example, competition for food, disease, or predation. A density-independent limiting factor affects a population regardless of its density — for example, a hard freeze, a flood, or a wildfire. Density-dependent factors tend to pull a population back toward its carrying capacity, while density-independent factors can strike no matter how sparse or crowded the population is.
Problem 6
Answer and explanation
215 individuals under the stated accounting.
Net change=30+10−20−5=15.
New size=200+15=215.
Response criteria
- Use the stated conditions.
- Show the evidence or calculation.
- Explain the conclusion and any stated limitation.
Problem 7
Hints
Include both migration flows, not just births and deaths.
Answer and explanation
−15 individuals.
Problem 8
Hints
State what the supplied observations or conditions establish, and separate that from any assumption.
Answer and explanation
Transmission may increase with crowding, while a storm can affect populations regardless of density, depending on the event.
Problem 9
Answer and explanation
More individuals can experience the same per-individual risk; density dependence concerns how that risk or effect changes with density.
A density-dependent effect changes per-individual impact with density, as selected competition or infection processes can. A density-independent event can affect abundance without that same dependence, though its final consequences still interact with conditions. A storm killing organisms does not automatically create feedback that restores a fixed population. Define the per-individual effect and compare densities under matched conditions. Changes in total losses can occur simply because more individuals are exposed even when the per-individual rate is unchanged.
More individuals can experience the same per-individual risk; density dependence concerns how that risk or effect changes with density.
Response criteria
- Read the structures, axes, directions and units correctly.
- Connect the evidence with the biological mechanism.
- Respect stated model assumptions and distinguish an observation from a further inference.
Problem 10
Answer and explanation
Final count is 80+20−12+9−5 = 92. Change is +12, or 12/80×100 = 15%, under the stated boundary and interval.
Final count is 80+20−12+9−5 = 92. Change is +12, or 12/80×100 = 15%, under the stated boundary and interval.
Response criteria
- Use the stated measurements or conditions, with correct units.
- Connect the result to the biological mechanism or evidence relationship.
- Identify the assumption, model limit or further evidence requested.
Problem 11
Answer and explanation
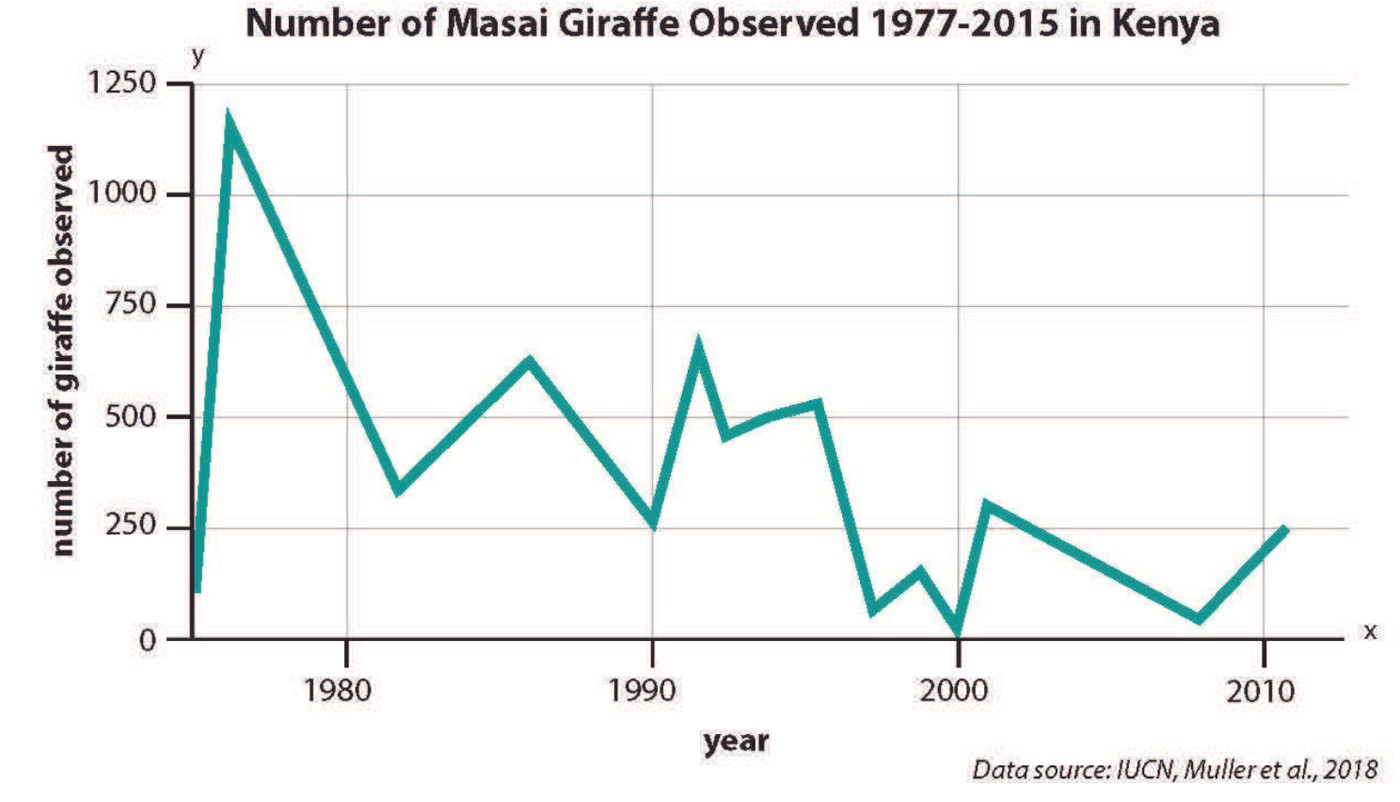
The high early peak exceeds 1,000 observed giraffes, while most later plotted counts are much lower. The record is not monotonic: a valid rise occurs just after the very low count near 2000. Trend descriptions depend on the chosen endpoints, so the early peak-to-later decline is not a claim that every possible interval declines. Neither a rise nor a decline isolates causality. Comparable survey area/effort, detection methods, dates/season and habitat or population movement information help interpret the counts.
Read the named organism, region, years and count axis.
Compare both a long interval and a specific rising segment rather than choose one convenient section.
Request sampling/detection and biological context before assigning a cause.
Response criteria
- Compare the high early peak with later values, identify a rising segment and explain why endpoint choice matters.
- Retain the organism/region/interval and observed-count meaning.
- State two relevant monitoring details and a causal limitation.