Mendelian Genetics — Practice · Grade 10 Science
Chapter: DNA, Inheritance & Gene ExpressionWhat this practice covers
By the end of Mendelian Genetics you should be able to:
- I can use a Punnett square to predict the genotype and phenotype ratios of a monohybrid cross.
- I can express genetic outcomes as probabilities and combine them using the multiplication rule.
11 questions, multiple choice, numeric and written answer, each with a worked explanation.
Vocabulary used: allele, dominant, recessive, homozygous, heterozygous, genotype, phenotype, Punnett square.
Problem 1
- no alleles for that trait
- two identical alleles (for example BB or bb)
- two different alleles (Bb)
- only one allele in total
Answer and explanation
two identical alleles (for example BB or bb)
Homozygous means the two alleles match (BB or bb); heterozygous (Bb) means they differ.
Problem 2
- A blend of brown and white
- It cannot be determined
- Brown
- White
Answer and explanation
Brown
One dominant B is enough to produce the brown phenotype, so Bb is brown.
Problem 3
Answer and explanation
25 %
Bb x Bb gives BB, Bb, Bb, bb — 1 of the 4 boxes (25%) is bb, the recessive phenotype.
Problem 4
Answer and explanation
Cross with bb under the model. Any bb offspring implies the tested parent supplied b. All dominant offspring in a small sample do not prove BB because Bb can produce such a sample by chance.
Problem 5
Answer and explanation
16 (1 out of this many)
Each tt has probability 1/4; multiplying independent events, 1/4 x 1/4 = 1/16, so 1 out of 16.
Problem 6
Answer and explanation
¼ AA, ½ Aa and ¼ aa; each offspring is a new probability event.
Each parent contributes A or a with probability one half.
The four equally likely combinations are AA, Aa, aA and aa.
Response criteria
- Use the stated conditions.
- Show the evidence or calculation.
- Explain the conclusion and any stated limitation.
Problem 7
Hints
Probabilities describe many outcomes, not a guaranteed pattern in every small family.
Answer and explanation
1/4=25%, combining a from each parent.
Problem 8
Hints
State what the supplied observations or conditions establish, and separate that from any assumption.
Answer and explanation
No. Both produce the dominant phenotype; more genotype or family evidence is required.
Problem 9
Answer and explanation
No. Each modeled independent outcome retains its probability; earlier outcomes do not force a balancing result.
A probability describes a model of possible outcomes, not a promised number in every small sample. For a recessive-category probability of 1/4 and 80 independent modeled offspring, the expected count is 20. Actual samples vary through chance, and unexpected counts require evaluation of sample size, model conditions and measurement rather than immediate rejection or certainty. Independent births in the model do not acquire a memory that forces the next child to balance earlier outcomes.
No. Each modeled independent outcome retains its probability; earlier outcomes do not force a balancing result.
Response criteria
- Read the structures, axes, directions and units correctly.
- Connect the evidence with the biological mechanism.
- Respect stated model assumptions and distinguish an observation from a further inference.
Problem 10
Answer and explanation
Expected aa count is 60×1/2=30. The probability of three Aa outcomes is (1/2)³=1/8. Neither expectation forces a specific finite family outcome.
Expected aa count is 60×1/2=30. The probability of three Aa outcomes is (1/2)³=1/8. Neither expectation forces a specific finite family outcome.
Response criteria
- Use the stated measurements or conditions, with correct units.
- Connect the result to the biological mechanism or evidence relationship.
- Identify the assumption, model limit or further evidence requested.
Problem 11
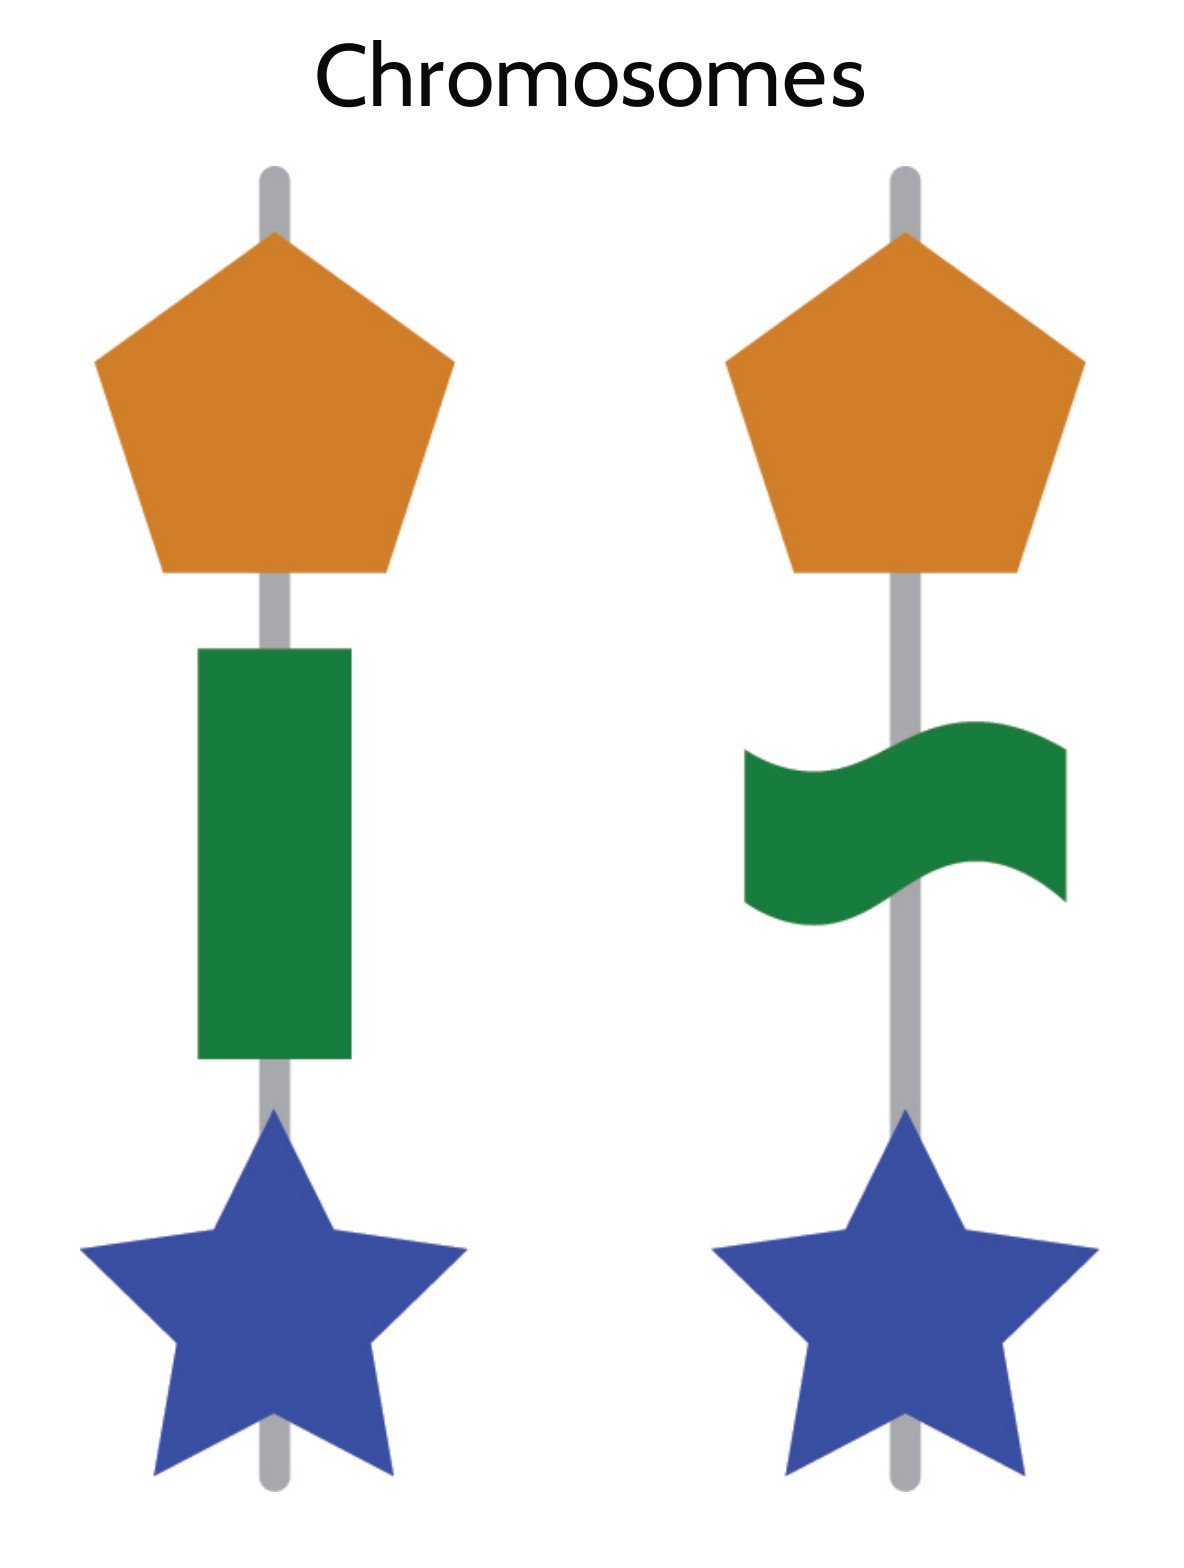
Answer and explanation
The orange and blue categories match while the green categories differ. They represent selected allele versions in a supplied model. A shape difference is not a nucleotide sequence, a measured chromosome deformity or proof of a dominance/trait relationship; those require the stated mapping and relevant functional/context evidence.
Compare corresponding marked positions on both homolog symbols.
Keep allele-category symbols separate from physical chromosome shape.
Request sequence, phenotype-model and functional/environment evidence before broader conclusions.
Response criteria
- Correctly compare matching orange/blue and differing green categories.
- Identify the drawing as an allele-category model.
- State the limits for sequence, dominance or causal trait claims.