Gas Particles, Diffusion & Pressure · Grade 8 Science
Chapter: Phases of MatterGas Particles, Diffusion & Pressure
Learning goals
- I can explain diffusion and gas pressure with particle motion and collisions.
- I can test a fixed-amount, matched-temperature pressure–volume model and identify its limits.
Readings for this unit
Before this unit
Review the earlier states/temperature particle models. The visible language notes explain this unit’s quantities; then connect them to its concrete records and figure.
Use three teaching sessions of about 40–45 minutes: first observe the phenomenon, draft a model and study Parts 1–2; next explain Parts 3–4 with the figures and evidence; then work the application, examples, practice, model revision and exit check. Divide any difficult part into smaller steps and revisit after feedback. Investigations, review and quizzes have separate sessions. Study the four visual parts across the scheduled sessions, then use the illustrated worked case and independent transfer questions. Extend or revisit a session when the learner cannot explain the figure; completion time is a proposed allocation, not a mastery guarantee.
Start with something to explain
What would explain the observations in gas particles, diffusion & pressure?
Illustrative evidence case. Illustrative constant-temperature records give 80 kPa at 60 mL and 120 kPa at 40 mL for one fixed gas sample.
Notice and wonder
What changes without changing particle identity? Write two observations from the supplied record without guessing their cause. Include a quantity and its unit when given. An observation is what was recorded; an inference is what you think explains it.
Write one question about why the pattern occurs and one question about a comparison that could distinguish competing explanations. A testable question identifies what could be observed or measured.
Your first model
Before reading the model answer, sketch the named objects or particles and label what you think changes. Explain the trend and test whether pressure × volume stays constant. Keep this first version so you can compare it with your later explanation.
Build the language from the idea
- diffusion
- Spreading caused by random particle motion.
- concentration
- Amount or number of particles per stated volume.
- gas pressure
- Force per unit area from gas impacts on a surface.
- compression
- Reduction of the space occupied by a material.
- absolute pressure
- Pressure measured relative to zero pressure, rather than only above local air pressure.
- model
- A representation that explains selected features and makes predictions; it leaves other details out.
- evidence
- Relevant observations or records used to support or challenge a claim.
- system boundary
- The chosen limit separating the objects being studied from their surroundings.
- assumption
- A condition taken as true for a model or calculation and needing to be checked against the case.
A closed bag can contain matter even when its contents cannot be seen. Air has mass and occupies space.
A gas consists of widely separated particles moving in many directions. A particle is a small constituent of matter; in air, many particles are molecules, which are groups of atoms held together.
The particles do not need a fan to begin moving. Random means their individual directions vary, not that their motion has no consequences.
Their collisions with walls produce a measurable push. We can use this model to explain spreading, squeezing and warming a gas without pretending to photograph its individual molecules.
An observation is what a person or instrument records. An inference is a proposed interpretation of those records. Keep the two separate: a graph can show a pattern while more than one mechanism might explain it. State the chosen system, or part of the world being studied, and its boundary before accounting for material or energy transfers.
Use each figure as a reasoning tool. Read its caption and labels, describe the pattern, then explain a cause. If the picture is schematic, use the stated numbers rather than measuring its printed size. Check whether its simplified conditions match the problem before applying a formula.
Build your understanding
Where this fits
This unit helps answer the chapter question: How can adding or removing energy change matter? Keep a notebook table with the question, evidence, explanation and one unresolved issue. Revise a previous model only when you can name the new evidence or idea that changes it.
Use three teaching sessions of about 40–45 minutes: first observe the phenomenon, draft a model and study Parts 1–2; next explain Parts 3–4 with the figures and evidence; then work the application, examples, practice, model revision and exit check. Divide any difficult part into smaller steps and revisit after feedback. Investigations, review and quizzes have separate sessions.
Part 1 · Explain spreading without a conveyor belt
Diffusion is the spreading and mixing produced by random particle motion. If particles are initially more concentrated in one region, more tend to leave that region than enter it until the concentration differences become smaller. Concentration here means the number of particles in a given volume.
Read the visual model
Diffusion is the spread of particles through their motion. The snapshots show distributions, not each particle’s exact path. Red is a tracking label for this model, not a literal color or proof of a chemical change.
Does more even spreading mean particles were created, or that every particle moved only to the right?
Visual reasoning — after your attempt
Neither. The four marked particles remain four. Individual motion can occur in many directions while the overall distribution becomes more even.
A drop of food coloring spreads through still room-temperature water. This is a liquid example of particle motion. Stirring also mixes water, but it adds large-scale fluid movement; a still-water observation should not automatically be explained as stirring.
Pause and explain
Does diffusion require every particle to move in the same direction?
Check your reasoning after answering
No. Individual particles move in varying directions. The overall distribution changes because more particles start in one region than another.
Part 2 · Connect collisions with pressure
Gas pressure is force per unit wall area resulting from many particle impacts. We cannot see an individual impact with our eyes, but a flexible wall can move as the collective push changes. Pressure is not a substance inside the bag.
Read the visual model
Pressure is force per area. Individual particles do not need to grow or stick to a wall to explain it. More frequent or stronger impacts can change the total force delivered per area over time.
Why can gas push on every wall rather than only the wall in the highlighted example?
Visual reasoning — after your attempt
Particles move in many directions and strike all walls. The highlighted collision explains a mechanism, not the only place where gas pressure acts.
Use an empty needle-free plastic syringe, if available, and cover its tip with a fingertip while pushing gently. The trapped air resists compression. Do not force the plunger or aim the tip at anyone. Supplied data give the same reasoning opportunity without this equipment.
Pause and explain
Why does trapped air resist being squeezed?
Check your reasoning after answering
The particles have less space and collide with the walls more frequently under comparable temperature conditions, increasing the pressure.
Part 3 · Change volume while keeping the comparison fair
Volume is the space occupied by the gas. In an approximately constant-temperature model with a fixed particle number, reducing volume increases pressure. The particles become closer together on average; each particle does not become smaller. A leak changes particle number and invalidates this particular comparison.
Read the visual model
A curve means the change is not a constant subtraction for each extra volume unit. Gas particles remain the same size; less volume changes collision opportunities. Use a supplied record instead of heating a sealed container.
Predict pressure at volume 3. Why would heating while compressing prevent a clean test of volume alone?
Visual reasoning — after your attempt
The model gives 120/3 = 40 kPa. Heating changes another influential variable, so the result would no longer isolate volume at fixed temperature.
Illustrative model values are 100 kPa at 40 mL and 200 kPa at 20 mL. The pressure is absolute pressure, measured relative to a vacuum, rather than only the extra pressure above room air. Use the stated numbers as a model, not a forecast for every syringe.
Pause and explain
What stayed fixed in this volume comparison?
Check your reasoning after answering
Particle number and temperature are assumed fixed. Volume changes, while particle size does not. A leaking syringe would not meet the fixed-particle assumption.
Part 4 · Distinguish a particle model from direct evidence
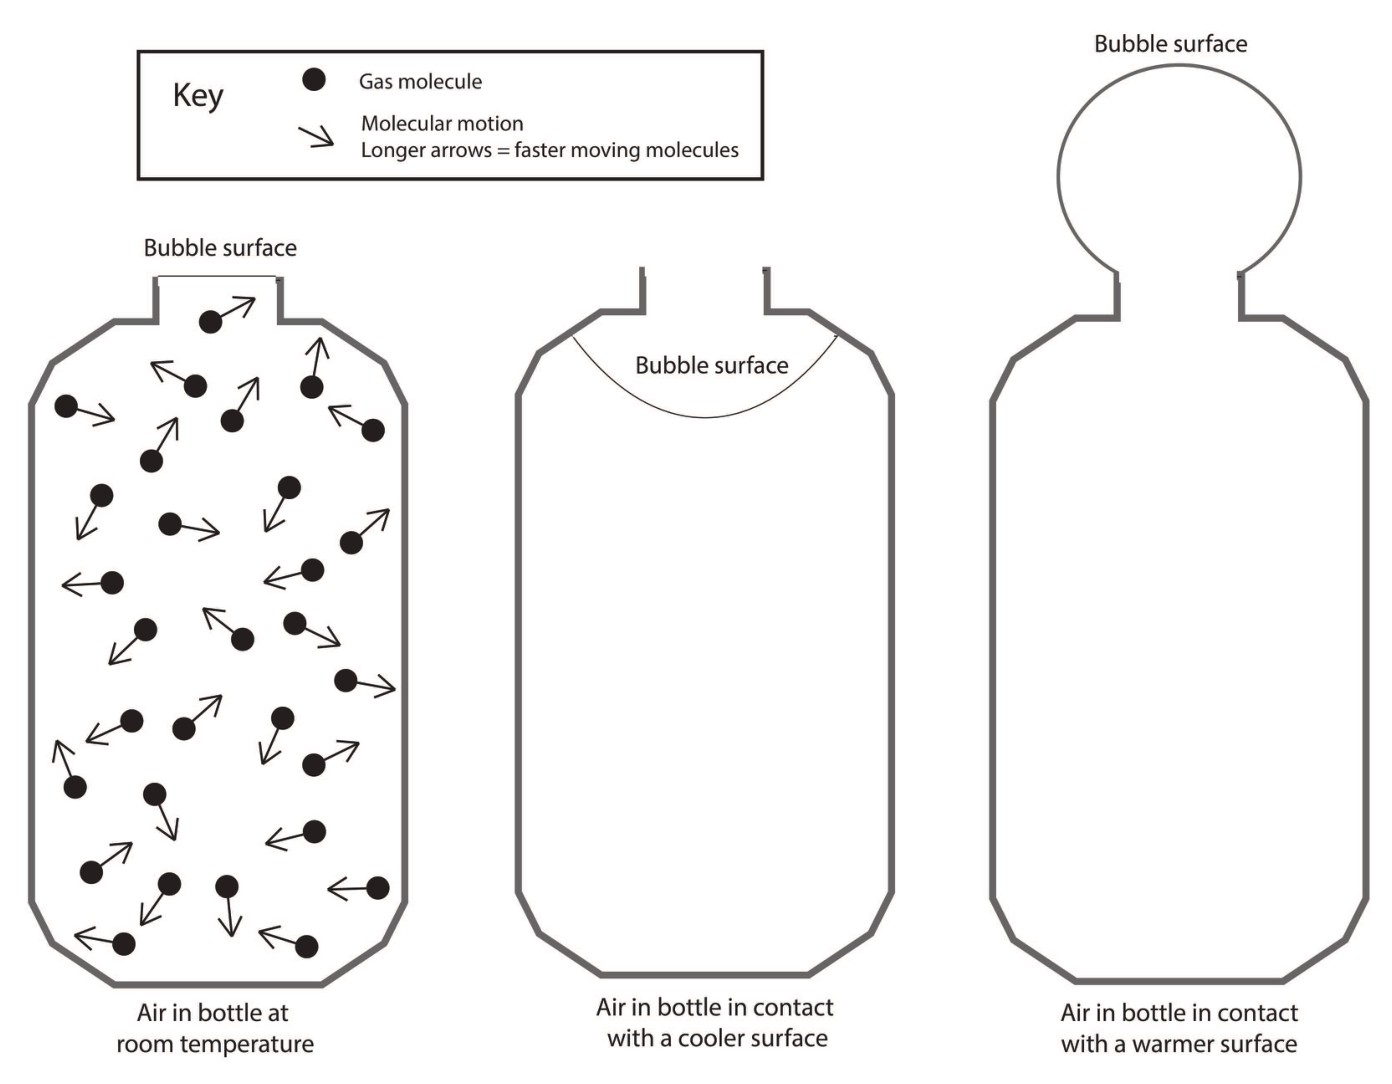
Warming a sealed rigid gas container increases average particle motion and can increase pressure. A diagram represents a proposed mechanism; measurements test the predicted relationship. The model needs a fixed amount of gas and a container that does not expand substantially.
Read the visual model
An observation is a record from a person or instrument. An inference interprets it. A model gains support when predictions fit several appropriate tests; a single gauge change does not reveal every microscopic detail.
Which entries are observations, and which are inferences? Suggest a useful next test.
Visual reasoning — after your attempt
Pressure readings and the measured smaller volume are observations. More frequent impacts and unchanged particle count are model claims supported by controlled conditions. Restore volume at fixed temperature and predict the pressure response.
Do not heat closed household containers. Instead compare supplied records of the same rigid vessel at two temperatures. Keep the vessel size and particle number explicit, and ask whether a different-size vessel would be a fair temperature test.
Pause and explain
Why not compare a warm large vessel with a cool small vessel to isolate temperature?
Check your reasoning after answering
Both temperature and volume change. Either can influence pressure, so the difference would not isolate temperature.
Apply the whole unit · A compressed gas
Illustrative case for analysis, not measurements collected by the learner. Illustrative constant-temperature records give 80 kPa at 60 mL and 120 kPa at 40 mL for one fixed gas sample.
Your task
Explain the trend and test whether pressure × volume stays constant. Use the supplied conditions, show intermediate reasoning and distinguish the supported conclusion from a broader claim.
What your response should show
- Use the specified quantities and units.
- Explain an intermediate step or comparison.
- Connect the pattern to the physical mechanism.
- State an assumption or limitation.
Response guidance — after your attempt
Compute the first pressure–volume product: 80×60=4,800 kPa·mL.
Compute the second: 120×40=4,800 kPa·mL, matching the model product.
Compare volume and pressure: decreasing volume at fixed temperature and particle number increases wall impacts; it does not shrink particles.
State that a leak or changing temperature would invalidate the intended comparison.
80×60=4,800 and 120×40=4,800 kPa·mL. The smaller volume gives greater pressure while the model product stays constant. The gas particles do not shrink; more frequent wall impacts explain the increased pressure. This evidence is conditional on fixed temperature and particle number.
Scientific references and adapted teaching resources
- OpenSciEd 6.2 Thermal Energy — public unit overview
- OpenSciEd instructional model — storyline routines
- Creative Commons Attribution 4.0 — middle-school material license
Parent / teacher teaching notes
Ask the learner to describe the phenomenon before naming a formula. Discuss each checkpoint after an attempt. Use the supplied records when equipment is unavailable and label them illustrative rather than actual measurements. The final explanation should identify a mechanism and a limit, with different defensible wording accepted. Adaptation credit: OpenSciEd middle-school teaching routines and public task structures by OpenSciEd, CC BY 4.0. This independent version adds original explanatory text, data and figures, terminology support and a home-study schedule. It does not reproduce the complete teacher editions or their classroom validation.
The key idea
The space between gas particles decreases; the individual molecules retain their sizes in this model. 80×60=4,800 and 120×40=4,800 kPa·mL.
Worked examples
Example 1 · Build the first reasoning step
- Identify what the question asks and what the stated observation establishes.
- No. Individual particles move in varying directions. The overall distribution changes because more particles start in one region than another.
Example 2 · A compressed gas
- Compute the first pressure–volume product: 80×60=4,800 kPa·mL.
- Compute the second: 120×40=4,800 kPa·mL, matching the model product.
- Compare volume and pressure: decreasing volume at fixed temperature and particle number increases wall impacts; it does not shrink particles.
- State that a leak or changing temperature would invalidate the intended comparison.
Explain why each stated condition matters.
Example 3 · Transfer to a different condition
- Identify the changed condition.
- No. Escaping gas changes particle number, so the fixed-amount assumption no longer applies. Account for matter crossing the boundary before testing that prediction.
Example 4 · Find and fix the mistake
- Distinguish what is observed from what is inferred.
- The space between gas particles decreases; the individual molecules retain their sizes in this model.
Compare the claim with the stated observations and model assumptions.
Example 5 · Interpret the visual model
- Identify the represented objects, axes, labeled quantities and stated conditions before choosing a rule.
- Diffusion is the spread of particles through their motion. The snapshots show distributions, not each particle’s exact path. Red is a tracking label for this model, not a literal color or proof of a chemical change.
- Neither. The four marked particles remain four. Individual motion can occur in many directions while the overall distribution becomes more even.
Keep the model’s stated limits explicit: Both closed-container snapshots contain twelve schematic background particles and four marked particles. The marked gas initially occupies a smaller region and is later more spread out. Particle identities and numbers remain fixed; individual motion and collisions, not a conveyor aimed toward empty space, produce spreading. Counts represent selected particles rather than an actual gas sample size.
Avoid these mistakes
- The space between gas particles decreases; the individual molecules retain their sizes in this model.
- Do not treat a schematic drawing as a scale measurement or a universal guarantee.
- Keep the stated comparison conditions and measurement boundary explicit.
- A correct numerical result needs units and an explanation of its meaning.
Check your understanding
Does diffusion require every particle to move in the same direction?
Discuss the answer
No. Individual particles move in varying directions. The overall distribution changes because more particles start in one region than another.
Why does trapped air resist being squeezed?
Discuss the answer
The particles have less space and collide with the walls more frequently under comparable temperature conditions, increasing the pressure.
What stayed fixed in this volume comparison?
Discuss the answer
Particle number and temperature are assumed fixed. Volume changes, while particle size does not. A leaking syringe would not meet the fixed-particle assumption.
Why not compare a warm large vessel with a cool small vessel to isolate temperature?
Discuss the answer
Both temperature and volume change. Either can influence pressure, so the difference would not isolate temperature.
Return to the phenomenon
Illustrative constant-temperature records give 80 kPa at 60 mL and 120 kPa at 40 mL for one fixed gas sample. Explain the trend and test whether pressure × volume stays constant. Revise your first explanation using a named idea from the lesson. Mark the changed part and the evidence that supports it.
Compare explanations after your attempt
80×60=4,800 and 120×40=4,800 kPa·mL. The smaller volume gives greater pressure while the model product stays constant. The gas particles do not shrink; more frequent wall impacts explain the increased pressure. This evidence is conditional on fixed temperature and particle number.
What should we investigate next?
Which condition could be changed to test a remaining uncertainty in this explanation? State the predicted observation and what result would challenge your model.
Investigate, explain and revise
Use these tasks after the three teaching sessions as needed. Discuss an attempted explanation before opening response guidance; a matching sentence is less important than a supported mechanism.
Activity 1 · Explain the new evidence case
Use the visible scenario above, Parts 1–4 and your first notebook model. No outside reading or equipment is required.
Your task
Illustrative constant-temperature records give 80 kPa at 60 mL and 120 kPa at 40 mL for one fixed gas sample. Explain the trend and test whether pressure × volume stays constant. Write 100–150 words or give a labeled drawing with an equivalent oral explanation.
Success criteria
- Use two relevant stated records or conditions.
- Explain the mechanism rather than only repeat a definition.
- Label observation and inference.
- Name a changed model feature or a remaining uncertainty.
Hint
Read the stated boundary and conditions before selecting a relationship. The unit’s worked examples show intermediate steps.
Response guidance — discuss after your attempt
80×60=4,800 and 120×40=4,800 kPa·mL. The smaller volume gives greater pressure while the model product stays constant. The gas particles do not shrink; more frequent wall impacts explain the increased pressure. This evidence is conditional on fixed temperature and particle number.
Activity 2 · Read and extend the figure
Study the new labeled figure and its caption, then compare it with the associated teaching part.
Your task
What changes without changing particle identity? Explain what each important label represents. Add one missing feature that would be needed for a different question, and explain why the original figure leaves it out.
Success criteria
- Answer the figure question with its stated labels.
- Connect the visual representation to the scientific idea.
- Identify a specific limitation from the caption.
- Propose a useful change without misrepresenting supplied evidence.
Hint
The dots stand for particles and are not to scale or literal colors. A fixed particle count is compressed into less space at matched temperature. More frequent wall impacts can increase gas pressure; the particles do not become smaller.
Response guidance — discuss after your attempt
Spacing, arrangement and allowed motion can change. In the gas compression model, volume changes while particle number and temperature are held fixed. The dots stand for particles and are not to scale or literal colors. A fixed particle count is compressed into less space at matched temperature. More frequent wall impacts can increase gas pressure; the particles do not become smaller.
Words to know
- diffusion
- Spreading caused by random particle motion.
- concentration
- Amount or number of particles per stated volume.
- gas pressure
- Force per unit area from gas impacts on a surface.
- compression
- Reduction of the space occupied by a material.
- absolute pressure
- Pressure measured relative to zero pressure, rather than only above local air pressure.
- model
- A representation that explains selected features and makes predictions; it leaves other details out.
- evidence
- Relevant observations or records used to support or challenge a claim.
- system boundary
- The chosen limit separating the objects being studied from their surroundings.
- assumption
- A condition taken as true for a model or calculation and needing to be checked against the case.
In the real world
Illustrative constant-temperature records give 80 kPa at 60 mL and 120 kPa at 40 mL for one fixed gas sample.
Exit check
What changes without changing particle identity? Explain the relevant mechanism and one model limitation.
Check your explanation after answering
Spacing, arrangement and allowed motion can change. In the gas compression model, volume changes while particle number and temperature are held fixed. The dots stand for particles and are not to scale or literal colors. A fixed particle count is compressed into less space at matched temperature. More frequent wall impacts can increase gas pressure; the particles do not become smaller.
Explain your reasoning without notes. If a key idea is missing, revisit the lesson and try again.