Atmosphere & Weather — Chapter Practice, Grade 9
Trace water and energy through the atmosphere and interpret changing weather evidence.
Problem 1
- Evaporation
- Condensation
- Precipitation
- Infiltration
Answer and explanation
Evaporation
The sun's energy heats liquid water until it evaporates into invisible water vapor.
Problem 2
- Transpiration
- Respiration
- Condensation
- Sublimation
Answer and explanation
Transpiration
Transpiration is water vapor released through tiny openings in plant leaves; combined with evaporation, it's called evapotranspiration.
Problem 3
- Precipitation
- Condensation
- Runoff
- Evaporation
Answer and explanation
Condensation
Condensation happens when rising, cooling air causes water vapor to turn back into liquid droplets, forming clouds.
Problem 4
Answer and explanation
97 %
Around 97% of Earth's water is salty ocean water; only about 3% is freshwater, and most of that is locked up as ice.
Problem 5
Answer and explanation
The sun's energy drives evaporation and transpiration, lifting liquid water into the air as vapor. Gravity pulls condensed water back down as precipitation and pulls runoff downhill into rivers, lakes, and groundwater.
Problem 6
Answer and explanation
The droplets can come from the air, rather than leaking through the glass.
Moist air contacts the colder surface and cools.
Some water vapor condenses into liquid on the outside.
Response criteria
- Use the stated conditions.
- Show the evidence or calculation.
- Explain the conclusion and any stated limitation.
Problem 7
Hints
Matter cycling does not mean energy follows the same closed loop.
Answer and explanation
Root uptake followed by transpiration releases water to the atmosphere.
Problem 8
Hints
State what the supplied observations or conditions establish, and separate that from any assumption.
Answer and explanation
Its local outflows can exceed inflows; global conservation does not require constant storage in each reservoir.
Problem 9
Answer and explanation
25 mL, because 100−55−20 = 25. The calculation assumes all relevant transfers and stores have been included over the matched interval.
Account for all the stated pathways over the same test interval. The bars are volumes rather than rates; the example neglects evaporation during the short test.
25 mL, because 100−55−20 = 25. The calculation assumes all relevant transfers and stores have been included over the matched interval.
Response criteria
- Read the labeled quantities, reference frame or objects correctly.
- Explain the relation between the visual evidence and the mechanism.
- Keep the drawing’s stated assumptions and limits in the conclusion.
Problem 10
Answer and explanation
Net input is 12 m³/day, so storage gains 60 m³ and reaches 310 m³. Lake area/shape or a volume-level relationship is needed for height change.
Subtract 40−28 = 12 m³/day.
Multiply by five days to obtain 60 m³ and add to 250.
Distinguish volume from height and request geometry.
Response criteria
- Use the stated measurements or conditions, with correct units.
- Connect the result to the physical mechanism or evidence relationship.
- Identify the assumption, model limit or further evidence requested.
Problem 11
Answer and explanation
150 units
200 − 50 = 150.
Problem 12
- absorbs energy from surrounding air
- releases energy to surrounding air
- destroys water molecules
- requires sunlight in every case
Answer and explanation
releases energy to surrounding air
The phase change releases energy.
Problem 13
Answer and explanation
Local terrain and conditions modify large-scale circulation.
Problem 14
Answer and explanation
The dark tile may warm more under the controlled conditions; real outdoor surfaces require additional evidence.
The dark tile is expected to absorb a larger share of sunlight.
Keep material, thickness, exposure and starting temperature comparable.
Response criteria
- Use the stated conditions.
- Show the evidence or calculation.
- Explain the conclusion and any stated limitation.
Problem 15
Hints
Actual circulation also depends on larger-scale wind and geography.
Answer and explanation
It creates temperature and pressure differences that move air and redistribute energy.
Problem 16
Hints
State what the supplied observations or conditions establish, and separate that from any assumption.
Answer and explanation
Convection transports energy with moving matter; radiation transfers energy electromagnetically.
Problem 17
Answer and explanation
Southward. Coriolis changes direction relative to the moving parcel; it does not always deflect east and does not initiate motion from rest.
Turn mentally to face each blue motion arrow, then identify its right or left side. Do not read right as a fixed page compass direction.
Southward. Coriolis changes direction relative to the moving parcel; it does not always deflect east and does not initiate motion from rest.
Response criteria
- Read the labeled quantities, reference frame or objects correctly.
- Explain the relation between the visual evidence and the mechanism.
- Keep the drawing’s stated assumptions and limits in the conclusion.
Problem 18
Answer and explanation
Right of northward motion is east, and right of eastward motion is south. Coriolis modifies existing motion in the rotating Earth frame; pressure-gradient or other forces initiate the wind. The complete wind also depends on friction and other forces.
Right of northward motion is east, and right of eastward motion is south. Coriolis modifies existing motion in the rotating Earth frame; pressure-gradient or other forces initiate the wind. The complete wind also depends on friction and other forces.
Response criteria
- Use the stated measurements or conditions, with correct units.
- Connect the result to the physical mechanism or evidence relationship.
- Identify the assumption, model limit or further evidence requested.
Problem 19
- Cold and dry
- Cold and moist
- Warm and dry
- Warm and moist
Answer and explanation
Cold and dry
'Continental' means it formed over land (dry), and 'polar' means it formed at a cold latitude.
Problem 20
- Front
- Barometer
- Isobar
- Station model
Answer and explanation
Front
The boundary between two air masses is a front — it's where the most active weather usually happens.
Problem 21
- Cold fronts move fast and bring brief, intense weather; warm fronts move slowly and bring longer, lighter weather.
- Cold fronts move slowly and bring long light rain; warm fronts move fast and bring brief storms.
- Both move at the same speed and bring identical weather.
- Warm fronts only occur in summer.
Answer and explanation
Cold fronts move fast and bring brief, intense weather; warm fronts move slowly and bring longer, lighter weather.
Cold fronts are steep and fast-moving, causing quick, intense weather; warm fronts are gradual and slow-moving, causing longer, gentler weather.
Problem 22
- High pressure
- Low pressure
- A stationary front
- An occluded front
Answer and explanation
High pressure
Sinking air piles up near the ground, creating high pressure and generally fair weather.
Problem 23
- A low-pressure system, with cloudier, stormier weather ahead
- A high-pressure system, with clear, calm weather ahead
- No change in the weather at all
- A broken barometer
Answer and explanation
A low-pressure system, with cloudier, stormier weather ahead
A reading well below the roughly 1013-millibar average indicates lower-than-average pressure, which is associated with rising air and increasing clouds or storms.
Problem 24
Answer and explanation
Air naturally flows from where it is denser and pressing down harder (high pressure) toward where it is less dense and pressing down less (low pressure), trying to balance out the difference — that flow of air from high to low is what we feel as wind.
Problem 25
Answer and explanation
A passing cold front is plausible; a map and additional observations would test it.
A cooler air mass replacing warmer air fits the temperature drop.
The wind shift and precipitation add supporting evidence.
Response criteria
- Use the stated conditions.
- Show the evidence or calculation.
- Explain the conclusion and any stated limitation.
Problem 26
Hints
A front does not guarantee identical weather everywhere.
Answer and explanation
Expansion and cooling can bring air to saturation, allowing condensation.
Problem 27
Hints
State what the supplied observations or conditions establish, and separate that from any assumption.
Answer and explanation
Temperature, humidity, origin region and movement provide important context.
Problem 28
Answer and explanation
Available moisture, stability, local flow and timing vary. Lifting supplies a process, while those conditions influence whether and how precipitation develops.
Trace the cool-air advance separately from the warmer-air uplift. The sloping boundary is a schematic cold front, not an identical geometry for every front.
Available moisture, stability, local flow and timing vary. Lifting supplies a process, while those conditions influence whether and how precipitation develops.
Response criteria
- Read the labeled quantities, reference frame or objects correctly.
- Explain the relation between the visual evidence and the mechanism.
- Keep the drawing’s stated assumptions and limits in the conclusion.
Problem 29
Answer and explanation
A is 0.04 hPa/km; B is 0.08 hPa/km, twice as large. Actual wind also responds to rotation and friction, so pressure-gradient magnitude alone is not a complete directional forecast.
Calculate 4/100 and 2/25 in matched units.
Compare 0.08 with 0.04: factor two.
Include rotation/friction and distinguish pressure-gradient force from wind.
Response criteria
- Use the stated measurements or conditions, with correct units.
- Connect the result to the physical mechanism or evidence relationship.
- Identify the assumption, model limit or further evidence requested.
Problem 30
- Isobar
- Isotherm
- Front
- Station model
Answer and explanation
Isobar
Isobars connect points of equal air pressure — 'iso' means equal and 'bar' refers to pressure.
Problem 31
- Barometer
- Anemometer
- Hygrometer
- Rain gauge
Answer and explanation
Barometer
A barometer measures air pressure; an anemometer measures wind speed, a hygrometer measures humidity, and a rain gauge measures precipitation.
Problem 32
- From west to east
- From east to west
- From north to south only
- Randomly, with no general pattern
Answer and explanation
From west to east
The prevailing westerlies and the jet stream generally steer mid-latitude weather from west to east.
Problem 33
- Strong winds, due to a big pressure difference over a short distance
- Calm winds, because the pressure is very steady
- An approaching heat wave with no wind
- That the map has an error
Answer and explanation
Strong winds, due to a big pressure difference over a short distance
Tightly packed isobars mean pressure changes quickly over a short distance, and bigger pressure differences drive stronger winds.
Problem 34
Answer and explanation
18 mb
1020 − 1002 = 18 mb. That's a fairly rapid fall, often a sign that stormier weather is on the way.
Problem 35
Answer and explanation
30 km/h over the measured interval; a later arrival estimate needs continued observations.
Average speed=180/6=30 km/h.
Future speed or direction can change, so straight extrapolation is an assumption.
Response criteria
- Use the stated conditions.
- Show the evidence or calculation.
- Explain the conclusion and any stated limitation.
Problem 36
Hints
A forecast is conditional and updated with new evidence.
Answer and explanation
Distance to the location and movement speed/direction over successive images, with allowance for growth or decay.
Problem 37
Hints
State what the supplied observations or conditions establish, and separate that from any assumption.
Answer and explanation
Initial-state uncertainty and evolving interactions can amplify differences in predictions.
Problem 38
Answer and explanation
1.5 h at 40 km/h and 2 h at 30 km/h, assuming steady speed along the stated path. Actual movement can evolve.
The curves share an initial position and direction but differ in slope. The vertical axis is travel distance, not temperature or precipitation probability.
1.5 h at 40 km/h and 2 h at 30 km/h, assuming steady speed along the stated path. Actual movement can evolve.
Response criteria
- Read the labeled quantities, reference frame or objects correctly.
- Explain the relation between the visual evidence and the mechanism.
- Keep the drawing’s stated assumptions and limits in the conclusion.
Problem 39
Answer and explanation
A gives 3 h and B 2 h. Record the forecast issue time, defined passage indicator/location and predicted intervals, then compare with later observations using the original criteria. Changing criteria after the event undermines verification.
A gives 3 h and B 2 h. Record the forecast issue time, defined passage indicator/location and predicted intervals, then compare with later observations using the original criteria. Changing criteria after the event undermines verification.
Response criteria
- Use the stated measurements or conditions, with correct units.
- Connect the result to the physical mechanism or evidence relationship.
- Identify the assumption, model limit or further evidence requested.
Problem 40
Answer and explanation
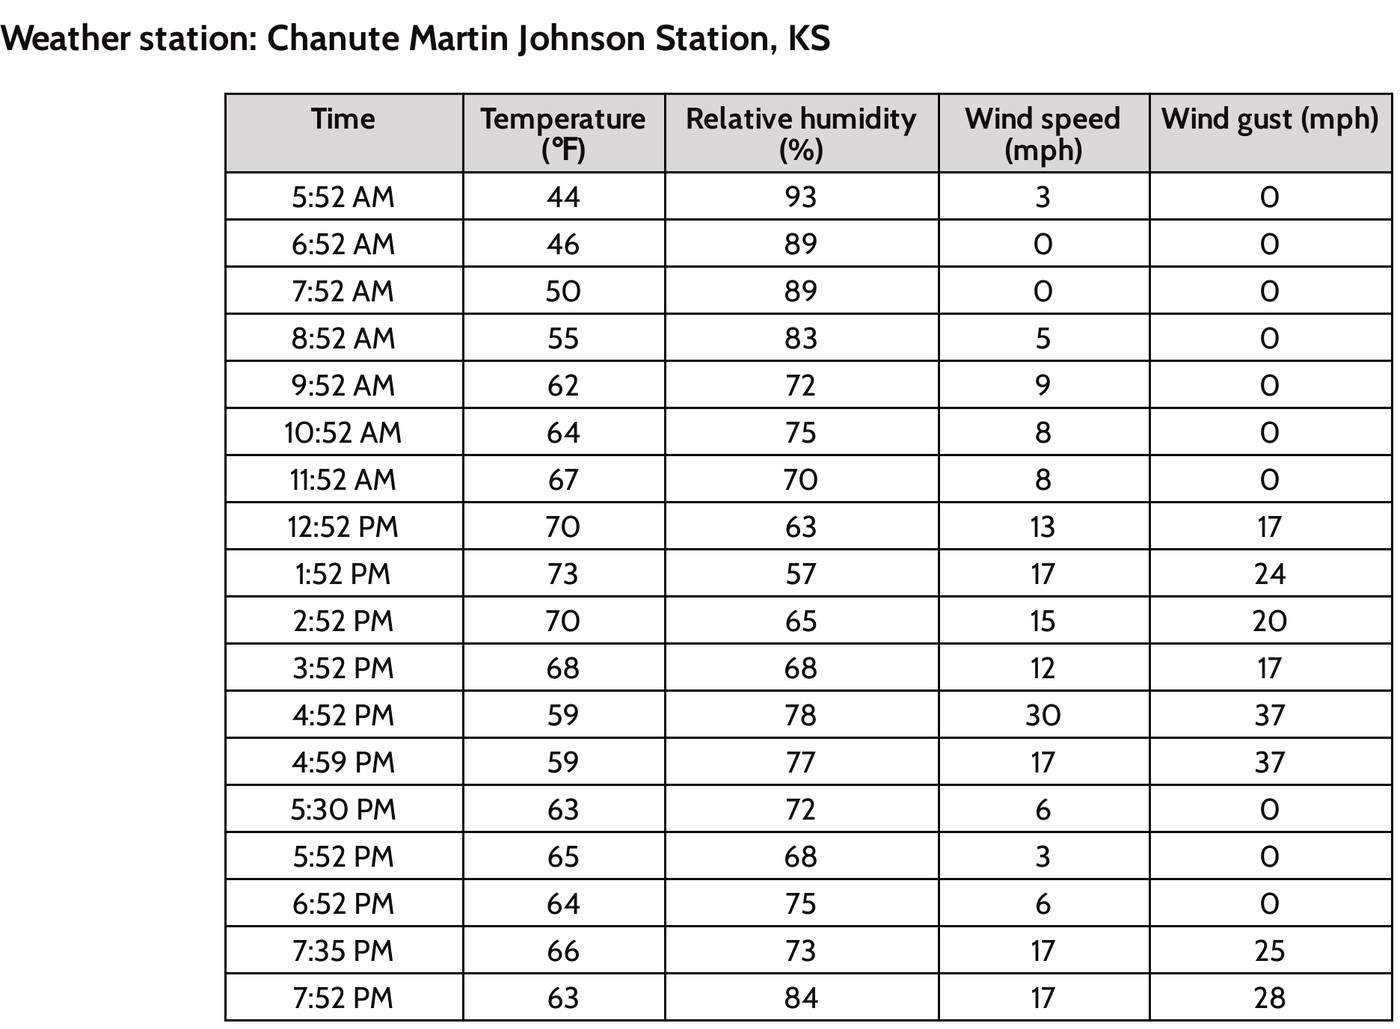
Temperature changes from 68 to 59 °F: −9 °F, equivalent to −5 °C. Relative humidity changes from 68% to 78%: +10 percentage points, not a 10% relative increase. Wind speed changes from 12 to 30 mph: +18 mph. The observations support a changing atmospheric situation at the named station; mapped front/pressure, wind direction, moisture and event-location evidence would help test causes. A humidity increase alone does not prove more water vapor, because saturation conditions change with temperature.
Read matching times and the correct source columns before subtracting.
Subtract later minus earlier: 59−68 = −9 °F; multiply the difference by 5/9 to obtain −5 °C. Do not subtract 32 when converting a temperature difference.
Compute 78−68 = 10 percentage points and 30−12 = 18 mph; gusts are a separate column.
State the station scale and time interval, then request independent mapped/process evidence rather than claim a unique cause.
Response criteria
- All changes use later minus earlier and retain correct units.
- Temperature-difference conversion and percentage-point distinction are correct.
- The inference is limited to the stated record and identifies evidence needed for a causal explanation.