Atmosphere & Weather — Print · Earth & Space Science, Grade 9
Trace water and energy through the atmosphere and interpret changing weather evidence.
Printable chapter lessons and review.
The Water Cycle
Learning goals
- I can name the major processes of the water cycle and put them in order.
- I can explain which force — the sun's energy or gravity — drives each step of the cycle.
Readings for this unit
Before this unit
Identify water's phases and changes of state.
Plan three teaching sessions: core explanation and Parts 1–2; Parts 3–4 with diagrams and reasoning checks; then the whole-unit application, worked examples, independent practice, and exit check. Read one part at a time, explain it without notes, and revisit any gap. Allow about 40–50 minutes per session; adjust after checking understanding. Trace and explain the labeled figures in each part. In the third session, complete the illustrated case and changed independent application; retain a corrected explanation rather than only an answer.
Start with something to explain
Why does the same rain not produce the same stream or lake response?
Illustrative evidence case. A short test partitions 100 mL of rain into runoff, infiltration and storage. A lake receives and loses water at separate rates.
Notice and wonder
Record two observations using the stated quantities or relationships. Keep observations separate from possible causes. Write one question that a new measurement could help answer.
Why does the same rain not produce the same stream or lake response?
Your first model
Draw reservoirs and labeled transfers; keep a store separate from a daily rate.
Build the language from the idea
- evaporation
- The change of liquid water into water vapor, powered by energy from the sun, mostly from the surface of oceans.
- condensation
- The change of water vapor into tiny liquid droplets as rising air cools, forming clouds.
- precipitation
- Water falling back to Earth's surface as rain, snow, sleet, or hail once droplets or ice crystals grow heavy enough.
- transpiration
- The release of water vapor from tiny openings in plant leaves; combined with evaporation, it's called evapotranspiration.
Every drop of water on Earth is a hand-me-down, recycled countless times over billions of years — the water you drank today may once have swirled in an ancient sea or drifted in a cloud over a dinosaur's head. The water cycle is the great loop that keeps moving that same fixed supply of water among the oceans, the sky, and the land. It usually starts with evaporation: the sun's energy heats liquid water, mostly at the wide surface of the oceans, giving the fastest-moving water molecules enough energy to break free and float up into the air as invisible water vapor. Plants add to the supply too, releasing water vapor through tiny pores in their leaves in a process called transpiration — combine the two and scientists call it evapotranspiration.
Rising air can expand and cool. At lower temperature, the saturation vapor pressure is lower; cooling a moist parcel can therefore bring it toward saturation without adding water vapor. Condensation produces tiny liquid droplets, and under suitable conditions ice crystals can also form. Visible clouds consist of these condensed particles; water vapor itself is invisible. Air does not act as a literal container that holds water. Condensation on a cold mirror or glass illustrates how cooling near a surface can change vapor into liquid.
Inside a cloud, droplets keep colliding and merging until some grow too heavy for the air to hold up — and gravity takes over, pulling them back to Earth as precipitation: rain, snow, sleet, or hail, depending on the temperatures they fall through. (Water can occasionally skip the liquid stage entirely: snow and ice sometimes turn straight into vapor through a bonus process called sublimation.) Which form falls where, and when, is a big part of what we experience as day-to-day weather.
Once precipitation reaches the ground, it splits up. Some soaks down into the soil and rock to become groundwater, and the rest becomes runoff, sliding downhill over the land into streams, rivers, and lakes and eventually back to the ocean — where it's ready to evaporate and start the whole trip over. Step back and you'll see the cycle runs on just two engines pulling in opposite directions: the sun's energy lifts water upward (through evaporation and transpiration), and gravity pulls it back down (through precipitation and runoff). Sun up, gravity down, over and over, without end.
It's worth knowing where all that water actually sits at any one moment. About 97 percent of Earth's water is salty ocean, and of the small freshwater slice that's left, most is frozen in ice sheets and glaciers or hidden underground — only a tiny fraction is the liquid surface water in lakes and rivers that living things depend on. That's why the water cycle isn't just a diagram to memorize: it's the system that refills the freshwater we drink, waters the crops we eat, and links a single rainy afternoon to the long-term climate patterns of an entire region.
Water moves among atmosphere, surface, living organisms and underground stores. Solar energy supports evaporation and atmospheric circulation; gravity supports precipitation and runoff. A water-cycle diagram should include stores as well as arrows.
Evaporation and transpiration return water to the atmosphere. Condensation requires cooling or other conditions that allow vapor to become liquid droplets. Clouds contain tiny droplets or ice, not merely invisible water vapor.
Residence times differ: water can pass quickly through a stream or remain much longer in ice or groundwater. Human withdrawals change flows without creating or destroying water. Use a defined region and interval when applying a water budget.
Build your understanding
Plan three teaching sessions: core explanation and Parts 1–2; Parts 3–4 with diagrams and reasoning checks; then the whole-unit application, worked examples, independent practice, and exit check. Read one part at a time, explain it without notes, and revisit any gap. Allow about 40–50 minutes per session; adjust after checking understanding.
Part 1 · Distinguish reservoirs from transfers
A reservoir is a store, such as a lake, glacier, soil, atmosphere or groundwater. A flux is a transfer rate, such as cubic metres per day entering a lake. A 1,000 m³ lake store and 50 m³/day inflow are different kinds of quantity; over four days that inflow supplies 200 m³ before outflows are considered. Water can follow repeated or alternate paths, so the water cycle is not one itinerary every molecule completes in order. Specify which store and interval are being described before comparing turnover or constructing a balance.
Read the visual model
Read cloud, surface water and ground as selected stores; read arrows as processes moving water. Reservoir pictures are not drawn to their actual volume ratios.
Can 1,000 m³ and 50 m³/day be added directly to get a new lake volume?
Visual reasoning — after your attempt
No. Convert the transfer rate over a specified time and account for outputs. Four days of that inflow provide 200 m³, not 50 m³ as a permanent addition independent of time.
A reservoir stores water; a flux transfers it at a rate. Oceans, glaciers, groundwater and the atmosphere have different sizes and turnover times. The water cycle is a network rather than a single sequence every molecule follows. Define the reservoir and interval before comparing storage and flow quantities.
A lake holding 1,000 m³ and receiving 100 m³ per day has a storage and an input rate with different units. An actual residence-time estimate also needs outflows, mixing and assumptions.
Pause and explain
Why can reservoir volume and daily flow not be added directly?
Check your reasoning after answering
They measure different quantities; a rate must be integrated over an interval to obtain a transferred volume.
Part 2 · Connect phase changes to energy
Evaporation takes molecules from liquid into vapor at a surface; the process requires energy and can cool the liquid or its surroundings. Condensation returns vapor molecules to liquid droplets and releases energy. Water vapor is the gas phase and is invisible; the visible cloud consists of tiny droplets or ice crystals rather than just invisible vapor. Latent energy is energy associated with a phase change that need not appear as a temperature rise during the change itself. Keep the material pathway separate from the energy transfer when drawing the model.
Read the visual model
Blue arrows track water-phase transfer; red arrows track energy direction for the selected process. They have different meanings and units.
Why is a visible cloud not simply a collection of invisible water-vapor molecules?
Visual reasoning — after your attempt
Visible cloud material is condensed droplets or ice. Vapor participates in their formation but is not itself the visible droplet/ice phase.
Evaporation transfers liquid molecules into vapor and takes energy from the surroundings; condensation releases energy as vapor becomes liquid. Freezing, melting and sublimation involve other state changes. Water vapor is invisible; visible cloud droplets or ice are condensed material. Identify both material transfer and energy transfer.
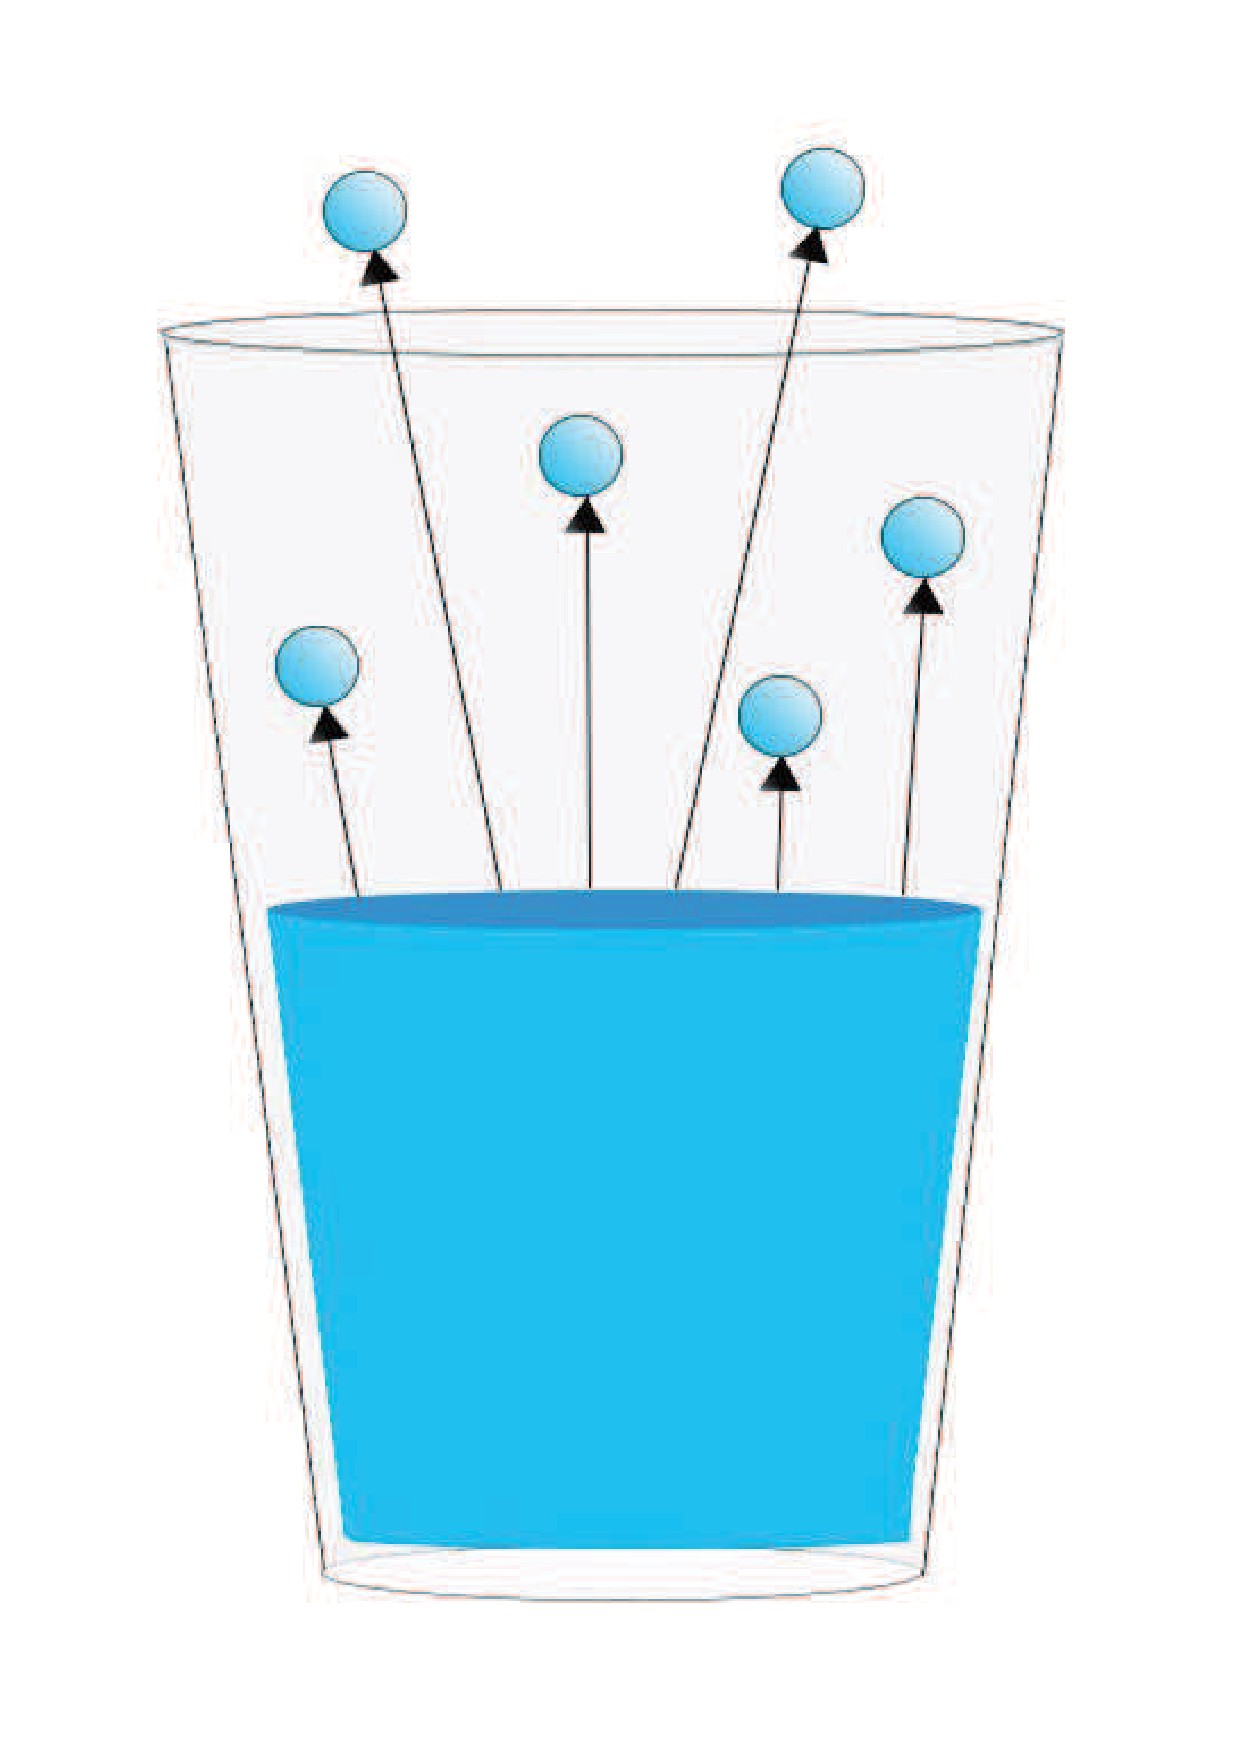
A cool surface can collect condensed water from moist air. The droplets are not created from nothing or squeezed out of dry material; explain the source of vapor and cooling conditions.
Pause and explain
Are visible clouds composed only of invisible water vapor?
Check your reasoning after answering
No. Their visible portions consist of tiny liquid droplets and/or ice crystals.
Part 3 · Explain precipitation and surface pathways
Precipitation is water falling from clouds as droplets or ice particles that have grown large enough to reach the surface under the conditions. Once on land, water can run off, enter the ground, collect temporarily or be taken up and later returned through plants. Transpiration is water loss to air from plants. Cover, slope, soil, rainfall rate and previous saturation influence how input partitions. A 100 mL input can yield only 35 mL of surface runoff while the remainder occupies other terms. Low runoff does not by itself mean missing water or no later groundwater discharge.
Read the visual model
Account for all the stated pathways over the same test interval. The bars are volumes rather than rates; the example neglects evaporation during the short test.
If runoff becomes 55 mL and surface storage stays 20 mL with the same 100 mL input, what infiltration remains under the stated model?
Visual reasoning — after your attempt
25 mL, because 100−55−20 = 25. The calculation assumes all relevant transfers and stores have been included over the matched interval.
Air can cool to conditions permitting condensation, but precipitation also requires droplets or crystals to grow enough to fall. After reaching land, water can run off, infiltrate, be stored or be taken up by organisms and later transpired. Slope, soil, cover and rainfall intensity affect the partition.
A paved and a vegetated surface receiving equal rain may produce different runoff. The difference does not mean the missing runoff disappeared; investigate infiltration, storage and evapotranspiration.
Pause and explain
Why can equal rainfall produce different runoff volumes?
Check your reasoning after answering
Different surface and subsurface conditions divide water among pathways differently.
Part 4 · Balance a reservoir across time
For the stated lake, inflow 50 m³/day minus total outflow 30 m³/day produces a net gain of 20 m³/day. Beginning at 400 m³, the model reaches 460 m³ after three days. A measured rise could result from greater inflow, smaller outflow or some combination, so a storage series alone does not uniquely identify a cause. Water level and storage volume also differ: converting volume change to height requires the lake’s area/shape relationship. A broad shallow lake and narrow basin can have different level changes for the same volume addition.
Read the visual model
The vertical axis measures storage volume, not height above sea level. Use the net transfer rate over the shown time.
Would a 60 m³ gain imply a 60 m rise in lake level? What else is needed?
Visual reasoning — after your attempt
No. Volume and height have different units. The lake’s geometry or volume-level relation is needed to convert the 60 m³ gain into a level change.
For a stated lake or catchment, changes in storage follow inputs minus outputs. Compare consistent units and time intervals. A rising water level does not by itself identify which input changed; level also depends on reservoir geometry and outflows. Use a balance to test an explanation.
A lake with 150 m³ input and 120 m³ output gains 30 m³ in the stated interval. Converting that volume to a level change requires the relevant surface area or a volume-level relation.
Pause and explain
What extra information is needed to turn storage-volume change into water-level change?
Check your reasoning after answering
Reservoir geometry, such as area or a valid relationship between volume and level.
Apply the whole unit · A pond after a storm
Illustrative daily volumes in m³: rain onto pond 40, inflow 100, outflow 90, evaporation 10, seepage out 20.
Your task
Draw and label the flows, calculate storage change, and explain which measurements would test an observed level rise.
What your response should show
- Use the supplied evidence accurately and label units or locations.
- Explain a physical mechanism or evidence-to-claim relationship.
- Show calculations or a clearly labeled model when the task calls for one.
- Identify a meaningful assumption, uncertainty, or competing explanation.
Response guidance — after your attempt
Inputs = 140; outputs = 120; storage increases 20 m³. Compare measured level with pond geometry and check unmeasured inflow or leakage. The balance alone cannot identify all changing pathways from one water-level observation.
Scientific references and adapted source material
Parent / teacher teaching notes
Use a closed-system diagram and ask where energy enters evaporation. Check that the learner distinguishes vapor, droplets, storage, flux and interval without treating the cycle as a fixed circle. Ask the learner to explain each visual label and causal step before calculating. Preserve a first model, attempt the changed independent case, then use feedback to revise. Diagrams state whether values are illustrative or observed. Selected OpenSciEd excerpts are middle-school source material used for supported foundations; the independent high-school explanations and supplements are not the complete OpenSciEd teacher editions or an endorsement.
An animated diagram of the water cycle showing evaporation from the ocean, condensation into clouds, precipitation falling over land, and runoff flowing back to the ocean.
The key idea
The sun's energy lifts water into the air as vapor (evaporation and transpiration), and gravity pulls it back down as precipitation and runoff — the same water endlessly recycles through air, land, and ocean.
Worked examples
Example 1
- Start at the ocean: the sun's energy heats the surface water until it evaporates into invisible water vapor that rises into the atmosphere. (Driven by the sun.)
- As the vapor rises and drifts inland on the wind, it cools and condenses into tiny liquid droplets that cluster together as clouds. (Driven by cooling air, made possible by the sun's earlier heating.)
- The droplets in the clouds keep colliding and growing as the clouds are pushed toward the mountains, until they're heavy enough to fall as precipitation — rain. (Driven by gravity.)
- The rain that doesn't soak into the ground runs downhill as runoff, collecting into streams that flow back toward the ocean. (Driven by gravity.)
Example 2 · Worked application
- Water molecules move among reservoirs and phases.
- Evaporation requires energy; condensation transfers energy to surroundings.
- A cycle describes pathways, not every molecule following one fixed route.
Matter cycling does not mean energy follows the same closed loop.
Example 3
- The water didn't vanish — matter doesn't just disappear.
- The sun's energy heated the puddle's surface, giving water molecules enough energy to escape into the air as water vapor.
- That process — liquid water turning into water vapor — is evaporation.
Example 4
- Moist air contacts the colder surface and cools.
- Some water vapor condenses into liquid on the outside.
Example 5 · Find and fix the mistake
- Test the claim against the stated conditions: Matter cycling does not mean energy follows the same closed loop.
- Visible clouds contain tiny liquid droplets and/or ice crystals; vapor is an invisible gas.
Matter cycling does not mean energy follows the same closed loop.
Example 6 · Reason from the visual evidence
- Account for all the stated pathways over the same test interval. The bars are volumes rather than rates; the example neglects evaporation during the short test.
- 25 mL, because 100−55−20 = 25. The calculation assumes all relevant transfers and stores have been included over the matched interval.
Original supplied short-test water partition. The 100 mL input is balanced by runoff, infiltration and temporary surface storage. Actual precipitation-to-runoff behavior also depends on conditions and additional terms; the diagram is not a universal landscape partition.
Avoid these mistakes
- A cloud's visible droplets are not the same as invisible water vapor.
Check your understanding
A covered cold glass collects water outside. Explain its likely source.
Discuss the answer
The droplets can come from the air, rather than leaking through the glass.
Why should groundwater appear as a store in a water-cycle model?
Discuss the answer
Water can be stored in saturated pores/fractures and exchanged later with streams or other reservoirs. Include groundwater storage and transfers within the selected water-budget boundary rather than assuming all rain immediately runs off.
Return to the phenomenon
Return to the initial case. Why does the same rain not produce the same stream or lake response? Revise your drawing or explanation using two named ideas and one stated limitation.
Compare explanations after your attempt
Rainfall partitions under landscape conditions, and a lake responds to inputs minus outputs across an interval. Phase changes transfer energy and water; visible clouds are condensed material. Level change also depends on basin geometry.
What should we investigate next?
Which comparison would test a remaining uncertainty? State what you would change, keep comparable and measure.
Investigate, explain and revise
Complete the tasks after studying the visual parts. Keep the first model and explain a revision before consulting the guidance.
Activity 1 · Explain the opening case
Use this unit’s opening record, Parts 1–4 and your notebook model. No external equipment or text is required for this supplied-data route.
Your task
Return to the initial case. Why does the same rain not produce the same stream or lake response? Revise your drawing or explanation using two named ideas and one stated limitation.
Success criteria
- Use two stated observations or conditions.
- Connect the mechanism to a labeled diagram or calculation.
- Identify what your original model missed.
- State a useful further test and a limitation.
Hint
Name the quantities and interactions before assigning a cause.
Response guidance — discuss after your attempt
Rainfall partitions under landscape conditions, and a lake responds to inputs minus outputs across an interval. Phase changes transfer energy and water; visible clouds are condensed material. Level change also depends on basin geometry.
Activity 2 · Transfer to a changed case
Use the figures, captions and vocabulary in this unit; cover the worked answer.
Your task
A lake starts at 250 m³. Daily input is 40 m³ and output 28 m³ for five days. Find final storage and explain why the height change cannot be determined from these data alone.
Success criteria
- Use the stated measurements or conditions, with correct units.
- Connect the result to the physical mechanism or evidence relationship.
- Identify the assumption, model limit or further evidence requested.
Hint
Separate measured values, calculated results and model assumptions.
Response guidance — discuss after your attempt
Net input is 12 m³/day, so storage gains 60 m³ and reaches 310 m³. Lake area/shape or a volume-level relationship is needed for height change.
Words to know
- evaporation
- The change of liquid water into water vapor, powered by energy from the sun, mostly from the surface of oceans.
- condensation
- The change of water vapor into tiny liquid droplets as rising air cools, forming clouds.
- precipitation
- Water falling back to Earth's surface as rain, snow, sleet, or hail once droplets or ice crystals grow heavy enough.
- transpiration
- The release of water vapor from tiny openings in plant leaves; combined with evaporation, it's called evapotranspiration.
Some water molecules linger for days — others for 10,000 years
Not all parts of the water cycle move at the same pace, a concept scientists call residence time. A given water molecule spends an average of only about 9 days in the atmosphere as vapor before falling back to Earth. In rivers, water might move through in just weeks. But water locked in deep groundwater aquifers, glaciers, or polar ice sheets can sit essentially unmoving for thousands to hundreds of thousands of years. That's part of why draining an ancient underground aquifer faster than rainfall can refill it isn't like draining a bathtub — some of that water took millennia to accumulate.
The water cycle is really an energy delivery system
Evaporation doesn't just move water — it moves enormous amounts of energy, because turning liquid water into vapor requires absorbing a large quantity of heat, called latent heat, that stays locked inside the vapor invisibly until it condenses back into liquid and releases that heat again. This is exactly why sweat cools your skin (evaporating sweat carries heat away from your body) and why hurricanes are so powerful: warm ocean water evaporates massive amounts of moisture, and when that water vapor condenses into storm clouds, it dumps huge amounts of stored energy back out, fueling the storm's winds.
A warmer atmosphere holds more water — and dumps it harder
Warmer air can physically hold more water vapor than cooler air — for roughly every 1°C of warming, the atmosphere's capacity to hold moisture increases by about 7%. As global average temperatures rise, this means storms forming in a warmer world have more water vapor available to condense and fall, which is part of why scientists expect (and are already measuring) more intense, heavier bursts of precipitation during storms even in regions that see the same or less total rainfall over a year. The water cycle described in this lesson and the climate patterns of this unit are directly connected.
Before satellites: the scientist who measured a whole river basin
For centuries, some thinkers doubted that rainfall alone could possibly supply all the water flowing in rivers. In the 1670s, French scientist Pierre Perrault actually measured it: he calculated the rainfall falling across the entire Seine River's drainage basin in France and compared it to the river's flow, showing that rainfall supplied roughly six times more water than the river carried away — proving, with real data for the first time, that the modern water cycle model was quantitatively correct rather than just a reasonable guess.
New York City's water cycle shortcut: gravity, not pumps
The water cycle described in this lesson isn't just an abstract diagram — it's the entire basis of how millions of people get their drinking water. New York City's water supply, collected as precipitation across protected forested watersheds in the Catskill Mountains over 100 miles away, travels to city taps almost entirely by gravity alone, with barely any mechanical pumping required, thanks to careful engineering of the elevation drop along the aqueduct system. It's one of very few major cities in the world where gravity does nearly all the work of water delivery.
In the real world
Reservoir managers track mountain snowpack — frozen precipitation waiting to melt and run off — because it predicts how much water will be available downstream months later.
Exit check
Explain how surface water can return as precipitation, naming phase changes and energy transfers.
Check your explanation after answering
Evaporation uses energy to transfer liquid water to vapor. Air can cool to saturation; condensation forms droplets and releases energy. Particles grow and fall as precipitation. Gravity and energy from sunlight help drive the cycle.
Explain your reasoning without notes. If a key idea is missing, revisit the lesson and try again.
Atmospheric Energy & Circulation
Learning goals
- I can explain how unequal solar heating drives atmospheric circulation.
- I can trace energy through radiation, convection, and phase changes.
Readings for this unit
Before this unit
Compare temperature, density and incoming solar energy.
Plan three teaching sessions: core explanation and Parts 1–2; Parts 3–4 with diagrams and reasoning checks; then the whole-unit application, worked examples, independent practice, and exit check. Read one part at a time, explain it without notes, and revisit any gap. Allow about 40–50 minutes per session; adjust after checking understanding. Trace and explain the labeled figures in each part. In the third session, complete the illustrated case and changed independent application; retain a corrected explanation rather than only an answer.
Start with something to explain
How does uneven heating become moving air and storm energy?
Illustrative evidence case. Equal beam energy falls over different areas. A rising air parcel expands, while water evaporates at one location and condenses elsewhere.
Notice and wonder
Record two observations using the stated quantities or relationships. Keep observations separate from possible causes. Write one question that a new measurement could help answer.
How does uneven heating become moving air and storm energy?
Your first model
Separate incoming energy, density/pressure relationships, air movement and phase-change transfers.
Build the language from the idea
- albedo
- The fraction of incoming radiation reflected by a surface.
- convection
- Energy transfer associated with the motion of a fluid.
- latent energy transfer
- Energy absorbed or released during a change of phase.
Sunlight heats Earth unevenly because of solar angle, day length, clouds, surface properties, and latitude. Some incoming radiation is reflected and some absorbed. Earth emits infrared radiation. Regional heating contrasts help create pressure differences that move air.
Warm air often expands and becomes less dense than nearby cooler air at comparable pressure. Rising air can cool as it expands; water vapor may condense into droplets when saturation is reached. Condensation releases energy to the surrounding air. Evaporation requires energy, linking the water cycle to energy transfer.
Earth’s rotation deflects large-scale moving air relative to the surface, helping organize circulation belts and prevailing winds. Mountains, oceans, and seasonal shifts modify these patterns. High pressure is often associated with sinking air and low pressure with rising air, but a pressure symbol alone does not guarantee a particular local forecast.
Sunlight warms Earth's surface, which transfers energy to air and emits infrared radiation. Uneven heating arises from latitude, time of day, season and surface properties. The resulting temperature differences help create pressure differences and circulation.
Warm air often expands and becomes less dense than nearby cooler air under comparable pressure. Rising and sinking movements interact with Earth's rotation and geography. A small convection demonstration illustrates one mechanism but cannot reproduce global circulation by itself.
Compare energy arriving, reflected and emitted. Albedo is the fraction reflected; darker surfaces often absorb more sunlight under otherwise similar conditions. A surface-temperature claim must also consider moisture, wind and heat storage, so color alone does not predict every real measurement.
Build your understanding
Plan three teaching sessions: core explanation and Parts 1–2; Parts 3–4 with diagrams and reasoning checks; then the whole-unit application, worked examples, independent practice, and exit check. Read one part at a time, explain it without notes, and revisit any gap. Allow about 40–50 minutes per session; adjust after checking understanding.
Part 1 · Uneven heating creates a physical question
A beam carrying a stated amount of energy can strike a small surface footprint nearly perpendicular to the surface or spread over a larger footprint at a low angle. The larger footprint receives less energy per square metre for the same beam energy. Albedo is the fraction of incoming radiation reflected; changing surface reflectivity changes how much is absorbed even at equal solar angle. Day length sets the receiving interval, and material heat capacity affects the resulting temperature response. These factors help explain uneven heating without treating solar angle alone as a complete local-weather prediction.
Read the visual model
The arrows represent selected equal-energy rays, while the surface footprint indicates spreading. Their oblique lengths are geometric illustrations, not a measured radiation intensity.
If equal beam energy is spread over twice the receiving area, what happens to energy per area?
Visual reasoning — after your attempt
It is halved under the stated equal-energy model. Reflection, receiving time and atmospheric conditions can still change actual absorbed energy.
Solar energy reaches different surfaces and latitudes at different angles and under different conditions. Reflection, absorption, surface heat capacity and day length affect temperature. Uneven heating helps create pressure and density differences that drive circulation, but local temperature is influenced by many processes.
A beam spread across a larger surface provides less energy per area than the same beam concentrated on a smaller area. Keep beam energy and angle controlled when using a flashlight model.
Pause and explain
Why can changing sunlight angle alter energy received per area?
Check your reasoning after answering
The same incoming energy is distributed over a different area, changing energy density.
Part 2 · Explain rising air and pressure gradients
A parcel is a selected small region of air used in a model. At comparable pressure, a warmer parcel can be less dense than surrounding air and receive net upward buoyant force. As it rises into lower surrounding pressure, it can expand and cool. Condensation may begin when the temperature/moisture conditions allow it. Horizontal pressure differences supply a pressure-gradient force that initiates air movement. Surface pressure reflects the overlying air column’s weight, so local warm temperature alone does not uniquely establish high or low surface pressure.
Read the visual model
The red arrow marks ascent; the same number of selected parcel markers is more spread out aloft. The adjacent column shows a qualitative decrease in pressure/density with height, not a counted real atmosphere. Horizontal gradients are a separate comparison described below.
Why is “warm air means low surface pressure everywhere” an incomplete rule?
Visual reasoning — after your attempt
Surface pressure depends on the mass and dynamics of the overlying column, while buoyancy compares a parcel with its surroundings at comparable pressure. Temperature alone does not supply the whole column balance.
Warm air can be less dense than surrounding air at comparable pressure, permitting buoyant motion. Rising air expands and can cool; cooling may lead to condensation when conditions allow. Horizontal pressure differences help drive wind. Surface pressure measures the weight of the overlying air column, not temperature alone.
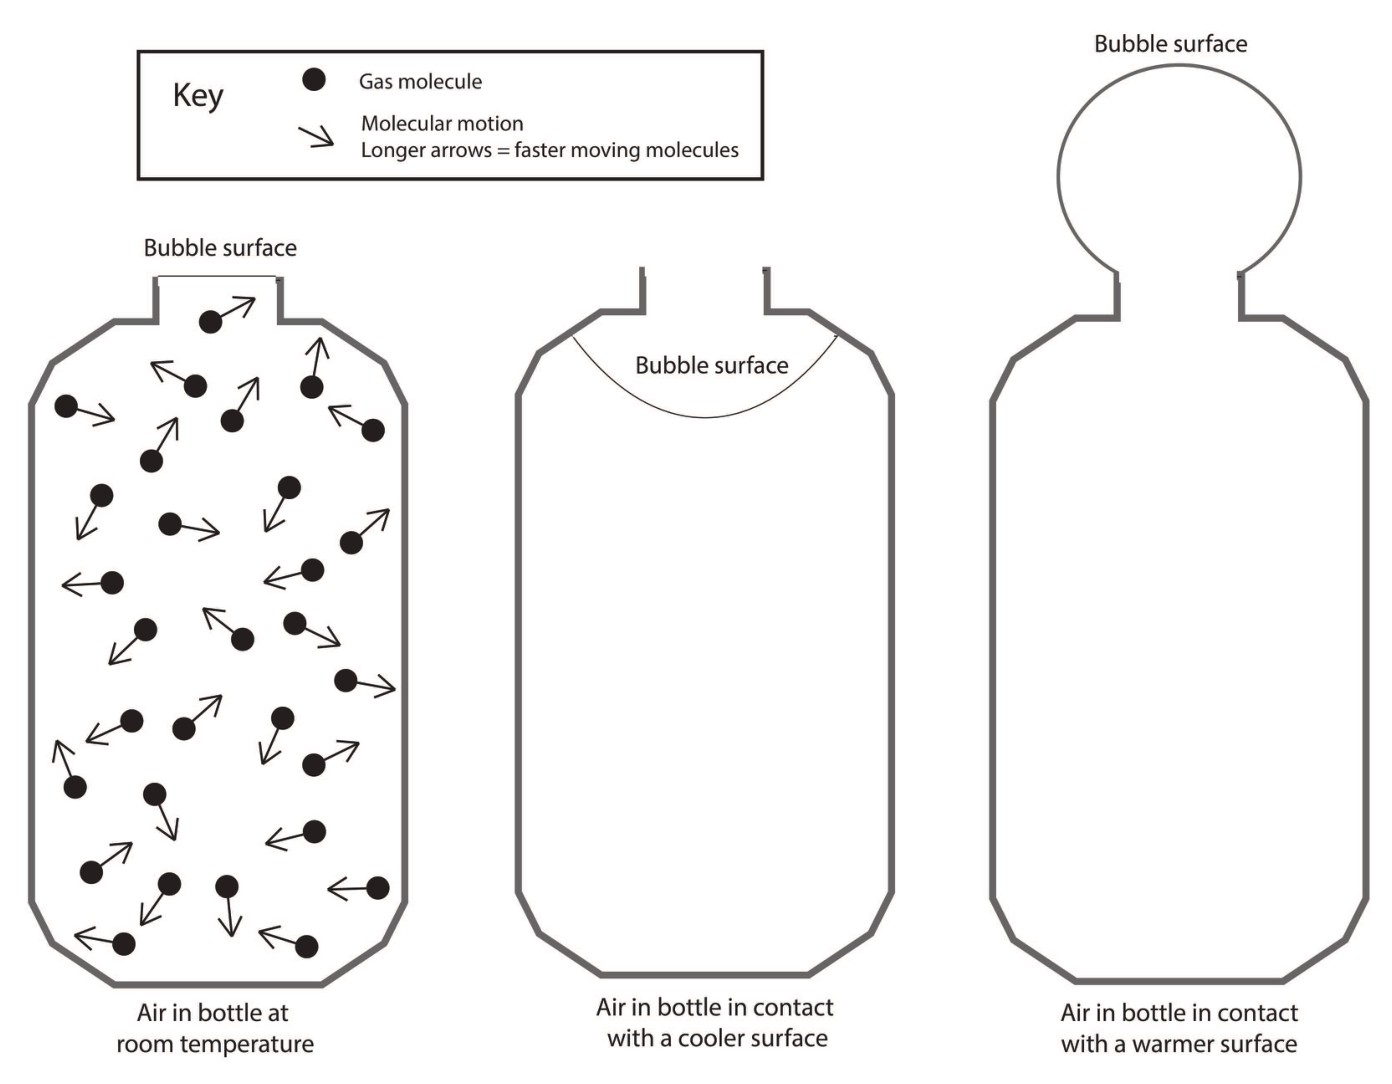
A warm room does not prove the region must have surface low pressure. Large-scale circulation, column mass and surrounding conditions matter. Explain the mechanism instead of equating warm with low in every setting.
Pause and explain
Why is surface pressure not determined by local temperature alone?
Check your reasoning after answering
It depends on the overlying air-column mass and circulation as well as thermal conditions.
Part 3 · Add rotation to a circulation model
The Coriolis effect describes apparent deflection in a rotating reference frame. For large-scale Earth motion it acts to the right of motion in the Northern Hemisphere and left in the Southern Hemisphere. Right of a northward motion is eastward, while right of an eastward motion is southward; the direction is not always east. It modifies movement initiated by other forces and is zero for air with no velocity in this simplified horizontal comparison. Friction, changing pressure patterns and boundaries also matter, so these arrows are not a complete wind forecast.
Read the visual model
Turn mentally to face each blue motion arrow, then identify its right or left side. Do not read right as a fixed page compass direction.
In the Northern Hemisphere, what direction is right of an eastward-moving parcel?
Visual reasoning — after your attempt
Southward. Coriolis changes direction relative to the moving parcel; it does not always deflect east and does not initiate motion from rest.
Earth’s rotation affects the apparent direction of large-scale moving air. Coriolis deflection is to the right of motion in the Northern Hemisphere and left in the Southern Hemisphere; it is not the initiating pressure-gradient force. Global circulation patterns also reflect friction, land distribution and seasonal changes.
A simple nonrotating hot-equator/cold-pole circulation is a first model. Adding rotation changes pathways and helps explain organized wind belts; label the first model’s missing process.
Pause and explain
Does Coriolis create wind from air initially at rest?
Check your reasoning after answering
It deflects motion in the rotating reference frame; pressure gradients and other forces initiate or sustain motion.
Part 4 · Trace radiation and latent-energy transfer
Evaporation at a surface takes energy from the local environment as liquid becomes vapor. The vapor can move with air. When it later condenses, phase-change energy is released in the new location, affecting the parcel and surrounding atmosphere. This is a form of latent-energy transfer. Solar radiation can supply energy at the surface, which then reaches the atmosphere by several pathways rather than only by direct sunlight absorption in air. Trace both water mass and energy; the same transfer diagram should not imply that energy or water is created in the cloud.
Read the visual model
Blue marks a selected vapor/matter pathway. Red arrows mark energy entering evaporation and being released by condensation at a different location.
How can the atmosphere above land gain energy associated with earlier evaporation over water?
Visual reasoning — after your attempt
Water vapor can be transported from the water surface and release latent energy when it condenses above land. The pathway links phase change and air movement.
Energy can move through radiation, contact and moving fluids. Evaporation and condensation transfer energy between surface and atmosphere. Rising moist air can release latent energy as condensation occurs, influencing weather systems. Distinguish movement of water from movement of energy and avoid treating all atmospheric heating as direct sunlight absorption.
A storm involves surface energy and moisture, air motion, phase changes and radiation. A mechanism diagram should connect these processes rather than label one arrow heat and omit the changing water state.
Pause and explain
How can evaporated surface water transfer energy to a different location?
Check your reasoning after answering
Energy absorbed during evaporation is carried with vapor and released upon condensation elsewhere.
Apply the whole unit · Compare two surface models
Illustrative equal-energy model: a dry surface warms 8 °C; a moist surface warms 3 °C and loses measurable water.
Your task
Explain two mechanisms that could contribute, propose controls to compare them, and sketch an energy-flow model with at least one stated limitation.
What your response should show
- Use the supplied evidence accurately and label units or locations.
- Explain a physical mechanism or evidence-to-claim relationship.
- Show calculations or a clearly labeled model when the task calls for one.
- Identify a meaningful assumption, uncertainty, or competing explanation.
Response guidance — after your attempt
Evaporation can use energy and water/surface properties can affect heat capacity. Equal energy is not enough unless material, exposure and measurements are comparable. Include radiation and evaporation pathways; do not assign the entire difference to one mechanism without tests.
Scientific references and adapted source material
Parent / teacher teaching notes
Ask for a pressure-gradient explanation before introducing deflection. Use diagrams with explicit arrows and labels; reteach any assertion that rotation alone starts every wind. Ask the learner to explain each visual label and causal step before calculating. Preserve a first model, attempt the changed independent case, then use feedback to revise. Diagrams state whether values are illustrative or observed. Selected OpenSciEd excerpts are middle-school source material used for supported foundations; the independent high-school explanations and supplements are not the complete OpenSciEd teacher editions or an endorsement.
The key idea
Unequal heating, water’s phase changes, and Earth’s rotation help organize atmospheric circulation.
Worked examples
Example 1
- First absorbs 100 − 60 = 40 units.
- Second absorbs 100 − 20 = 80 units.
Example 2 · Worked application
- Warmer land air rises, creating a local pressure pattern.
- Cooler near-surface air moves from sea toward land; return flow closes the circulation aloft.
Actual circulation also depends on larger-scale wind and geography.
Example 3
- The dark tile is expected to absorb a larger share of sunlight.
- Keep material, thickness, exposure and starting temperature comparable.
Example 4 · Find and fix the mistake
- Test the claim against the stated conditions: Actual circulation also depends on larger-scale wind and geography.
- Buoyancy of less dense warm air drives this convection. Heat can transfer in many directions by conduction and radiation.
Actual circulation also depends on larger-scale wind and geography.
Example 5 · Reason from the visual evidence
- Turn mentally to face each blue motion arrow, then identify its right or left side. Do not read right as a fixed page compass direction.
- Southward. Coriolis changes direction relative to the moving parcel; it does not always deflect east and does not initiate motion from rest.
Original selected-direction Coriolis diagrams in a top-view Earth frame. Arrows compare direction only and do not represent measured accelerations. The effect depends on latitude and speed; friction and other forces are omitted.
Avoid these mistakes
- Atmospheric circulation is not explained by warm air rising alone.
Check your understanding
Two identical dry tiles, one dark and one light, receive the same sunlight. Predict a difference and name a control.
Discuss the answer
The dark tile may warm more under the controlled conditions; real outdoor surfaces require additional evidence.
Why does a small convection box not fully model global winds?
Discuss the answer
A box can model selected heating and buoyancy but omits Earth rotation, globe geometry, land/ocean distribution, scales and changing pressure patterns. It cannot by itself predict all global winds.
Return to the phenomenon
Return to the initial case. How does uneven heating become moving air and storm energy? Revise your drawing or explanation using two named ideas and one stated limitation.
Compare explanations after your attempt
Angle and surface properties influence heating. Buoyancy and pressure gradients act in different comparisons; rotation modifies moving air. Transported vapor releases latent energy during later condensation, linking surface and atmospheric energy.
What should we investigate next?
Which comparison would test a remaining uncertainty? State what you would change, keep comparable and measure.
Investigate, explain and revise
Complete the tasks after studying the visual parts. Keep the first model and explain a revision before consulting the guidance.
Activity 1 · Explain the opening case
Use this unit’s opening record, Parts 1–4 and your notebook model. No external equipment or text is required for this supplied-data route.
Your task
Return to the initial case. How does uneven heating become moving air and storm energy? Revise your drawing or explanation using two named ideas and one stated limitation.
Success criteria
- Use two stated observations or conditions.
- Connect the mechanism to a labeled diagram or calculation.
- Identify what your original model missed.
- State a useful further test and a limitation.
Hint
Name the quantities and interactions before assigning a cause.
Response guidance — discuss after your attempt
Angle and surface properties influence heating. Buoyancy and pressure gradients act in different comparisons; rotation modifies moving air. Transported vapor releases latent energy during later condensation, linking surface and atmospheric energy.
Activity 2 · Transfer to a changed case
Use the figures, captions and vocabulary in this unit; cover the worked answer.
Your task
A Northern Hemisphere air parcel initially moves north, while another moves east. Give the Coriolis deflection direction for each and explain why the effect does not begin a wind from rest.
Success criteria
- Use the stated measurements or conditions, with correct units.
- Connect the result to the physical mechanism or evidence relationship.
- Identify the assumption, model limit or further evidence requested.
Hint
Separate measured values, calculated results and model assumptions.
Response guidance — discuss after your attempt
Right of northward motion is east, and right of eastward motion is south. Coriolis modifies existing motion in the rotating Earth frame; pressure-gradient or other forces initiate the wind. The complete wind also depends on friction and other forces.
Words to know
- albedo
- The fraction of incoming radiation reflected by a surface.
- convection
- Energy transfer associated with the motion of a fluid.
- latent energy transfer
- Energy absorbed or released during a change of phase.
In the real world
Exit check
Why is energy transfer part of the water cycle rather than a separate topic?
Check your explanation after answering
Changes of phase absorb or release energy, and moving water and vapor transport that energy between parts of the Earth system.
Explain your reasoning without notes. If a key idea is missing, revisit the lesson and try again.
Air Masses, Fronts & Pressure
Learning goals
- I can classify an air mass by where it formed, using the terms continental, maritime, polar, and tropical.
- I can compare how cold fronts and warm fronts differ in speed and the weather they bring.
- I can relate high and low air pressure to sinking/rising air and fair/stormy weather.
Readings for this unit
Before this unit
Read pressure maps and distinguish air-mass temperature from moisture.
Plan three teaching sessions: core explanation and Parts 1–2; Parts 3–4 with diagrams and reasoning checks; then the whole-unit application, worked examples, independent practice, and exit check. Read one part at a time, explain it without notes, and revisit any gap. Allow about 40–50 minutes per session; adjust after checking understanding. Trace and explain the labeled figures in each part. In the third session, complete the illustrated case and changed independent application; retain a corrected explanation rather than only an answer.
Start with something to explain
Why does a passing front change more than temperature?
Illustrative evidence case. A supplied station sequence includes falling then rising pressure, a temperature drop, a wind shift and showers ending.
Notice and wonder
Record two observations using the stated quantities or relationships. Keep observations separate from possible causes. Write one question that a new measurement could help answer.
Why does a passing front change more than temperature?
Your first model
Sketch source air masses, the boundary, lifting and expected observation sequence.
Build the language from the idea
- air mass
- A huge body of air that takes on a fairly uniform temperature and humidity from the surface it sits over for days at a time.
- front
- The boundary where two different air masses meet — usually the setting for a region's most active weather.
- air pressure
- The weight of the air pressing down on a given area, measured with a barometer.
- barometer
- An instrument that measures air pressure, useful for tracking whether weather is likely to clear or worsen.
Step outside and the air you feel might belong to a single enormous air mass — a body of atmosphere often hundreds of miles across that has parked over one kind of surface long enough to take on its temperature and moisture, becoming fairly uniform throughout. Meteorologists label each air mass with two letters that tell you where it was born. The first, lowercase letter gives its moisture: continental (c) forms over land and stays dry, while maritime (m) forms over the ocean and stays moist. The second, capital letter gives its temperature: polar (P) is cold, tropical (T) is warm. Snap them together and you can read an air mass at a glance — a continental polar (cP) mass forming over frozen northern Canada is cold and dry, while a maritime tropical (mT) mass forming over the Gulf of Mexico is warm and soggy.
The real drama happens where two air masses meet but refuse to blend, along a boundary called a front. A cold front forms when a cold, dense air mass comes charging in and shoves under a warmer one, forcing that warm air to rise steeply and fast — like a snowplow scooping air upward. Because the boundary is steep and moves quickly, the rising warm air's moisture condenses in a hurry, so cold fronts tend to deliver a short, punchy burst of weather: gusty winds and heavy rain or thunderstorms, followed by rapid clearing into noticeably cooler, fresher air.
A warm front is the mirror image, and it takes its time. Here warm air slides slowly up and over a retreating wedge of cold air along a long, gentle ramp, so instead of a sudden storm it announces itself hours ahead with clouds that gradually lower and thicken, followed by a long stretch of light, steady rain or snow before the warmer air finally arrives. When a speedy cold front catches up to a plodding warm front and lifts it off the ground, the two combine into an occluded front; a boundary that stalls and just sits in place is a stationary front.
Fronts don't wander on their own — they're steered by patterns of air pressure, the weight of the atmosphere pressing down on a given spot, which we measure with a barometer. Air pressure changes because air is always either sinking or rising somewhere. Where air is sinking, it piles up and presses down harder, creating high pressure; that sinking, drying air usually brings clear, calm, fair weather. Where air is rising, it leaves less atmosphere pressing down, creating low pressure; the rising air cools, its moisture condenses, and clouds and storms tend to follow.
This is also what makes the wind blow. Air always rushes from areas of higher pressure toward areas of lower pressure, trying to even out the difference — and the bigger the pressure gap, the stronger the wind. That's why storms organize themselves around low-pressure centers: air spirals inward and upward toward the low, feeding the very clouds and rain that define bad weather. Put it all together and a weather map starts to read like a story — high-pressure zones promising calm, low-pressure centers trailing their fronts, and the wind telling you which way it's all about to move.
An air mass develops characteristic temperature and moisture over a source region. When air masses meet, a front can lift air and change weather. The type and timing depend on motion and conditions rather than the front's name alone.
Pressure differences drive horizontal air movement, modified by rotation, friction and terrain. Isobars show equal pressure, and closer spacing generally indicates a stronger pressure gradient. Read units and map time before comparing patterns.
Rising moist air cools and may form clouds or precipitation. High and low pressure are useful patterns but not guarantees of clear sky or storms at every location. Use pressure, wind, moisture and temperature observations together to make a forecast.
Build your understanding
Plan three teaching sessions: core explanation and Parts 1–2; Parts 3–4 with diagrams and reasoning checks; then the whole-unit application, worked examples, independent practice, and exit check. Read one part at a time, explain it without notes, and revisit any gap. Allow about 40–50 minutes per session; adjust after checking understanding.
Part 1 · Identify air masses by source conditions
An air mass is a broad air region with relatively similar temperature and moisture properties. Continental refers to a land source and maritime to a water source; polar and tropical describe broad thermal source settings. These terms summarize initial tendencies rather than a fixed temperature or humidity at every point. As air moves across warmer water, mountains or other regions, surface exchanges, lifting and mixing can modify it. A source label therefore contributes to weather reasoning but does not replace current observations or a trajectory model.
Read the visual model
Compare the supplied source conditions, then consider what the air travels over after leaving them. The panels are settings, not mapped present air masses.
Why could a continental-polar air mass become moister after moving across a large lake?
Visual reasoning — after your attempt
Surface evaporation and mixing can add water vapor under suitable conditions, changing moisture properties while the original source label remains useful historical context.
An air mass has relatively similar temperature and moisture characteristics over a large area. Its source region helps shape those properties, but movement modifies them. Continental/maritime and polar/tropical labels are a useful first description, not exact local temperature or humidity predictions for every point.
A maritime air mass moving over land can change through heating, cooling and moisture exchanges. Track its history rather than assume that its initial label stays perfectly unchanged.
Pause and explain
Why can an air mass change after leaving its source region?
Check your reasoning after answering
It exchanges energy and moisture with the surfaces and air encountered along its path.
Part 2 · Use pressure patterns to explain wind
An isobar connects locations with equal air pressure in a map analysis. The pressure-gradient force acts toward lower pressure, perpendicular to local isobars. For the same isobar interval and map scale, tighter spacing indicates a larger pressure change over distance. Earth’s rotation and surface friction modify actual wind direction, so a single straight arrow from H to L is incomplete. Pressure in hectopascals uses 1 hPa = 100 Pa. Always read the interval: two closely drawn 1 hPa lines need not indicate a larger gradient than farther-apart 8 hPa lines.
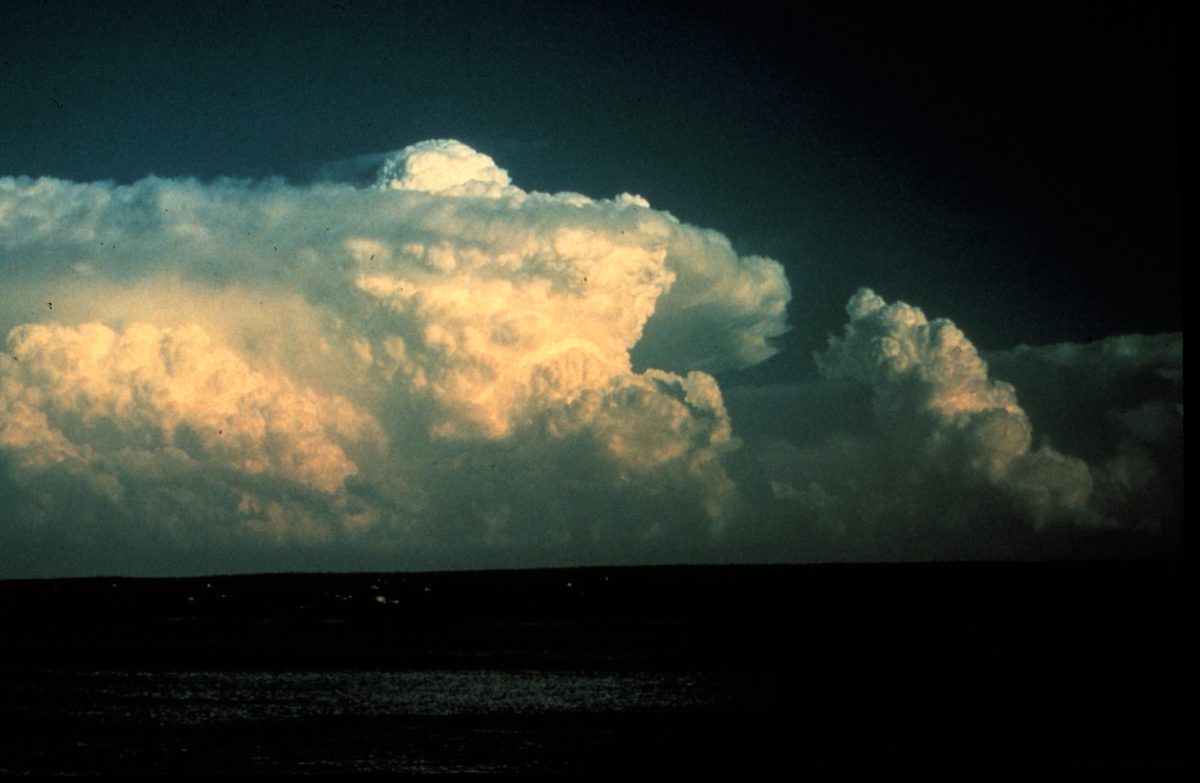
Read the visual model
Read the nested pressure labels and the inward selected force arrow. The red arrow is a pressure-gradient force, not a complete surface-wind forecast.
Why can isobar spacing not be compared fairly between maps with different pressure intervals?
Visual reasoning — after your attempt
Gradient is pressure change per distance. Both interval and ground scale must be checked; spacing alone does not provide the same pressure change.
A pressure-gradient force points from higher toward lower pressure. Earth’s rotation and surface friction modify the wind direction, so real wind does not generally travel straight from an H symbol to an L symbol. Isobar spacing can indicate gradient strength when interval and scale are comparable.
Closer isobars at the same scale and interval represent a stronger gradient. Compare actual pressure differences and distance instead of judging a map with different contour intervals by appearance alone.
Pause and explain
Why must isobar interval be checked before comparing spacing?
Check your reasoning after answering
A different interval changes the pressure difference represented by each space.
Part 3 · Connect frontal geometry with uplift
A front separates contrasting air masses and can provide lifting. At a cold front, advancing denser cool air often undercuts warmer air; at a warm front, advancing warmer air commonly rises over a cooler wedge with a gentler typical slope. Rising air can expand and cool, allowing condensation under suitable moisture conditions. Stability concerns whether a displaced parcel tends to keep moving or return relative to its surroundings. Moisture, stability and front motion therefore influence cloud/precipitation patterns; the boundary alone does not guarantee identical rain everywhere.
Read the visual model
Trace the cool-air advance separately from the warmer-air uplift. The sloping boundary is a schematic cold front, not an identical geometry for every front.
Why does the lifting shown here not prove that every location along the front must have the same precipitation?
Visual reasoning — after your attempt
Available moisture, stability, local flow and timing vary. Lifting supplies a process, while those conditions influence whether and how precipitation develops.
A front separates contrasting air masses. A cold front often has advancing cooler air undercutting warmer air; a warm front commonly has advancing warm air rising over cooler air. Lift and moisture can support cloud and precipitation, but the outcome depends on stability, moisture and movement.
The triangles or semicircles on a surface map identify front type and indicate its conventional movement direction. They do not show the exact vertical slope or guarantee rain at every point along it.
Pause and explain
Why does a front not guarantee identical precipitation everywhere?
Check your reasoning after answering
Moisture, stability, lifting strength and local conditions vary along the boundary.
Part 4 · Combine evidence across a weather passage
A time series orders observations using the same location and measurement convention. In the supplied record, temperature rises before dropping, pressure falls before recovering and wind shifts toward the northwest as showers end. Together those indicators support a front-passage interpretation more strongly than a temperature drop alone. A forecast should state where, when and which measurable conditions are expected, plus what could change it. Later observations can test both the predicted event and its timing; matching only a broad statement such as weather changes is weak verification.
Read the visual model
Read the temperature curve alongside the written pressure and wind sequence. The measurements have different units and should be related mechanistically rather than added.
What strengthens the front-passage inference beyond the fall from 23 to 16 °C?
Visual reasoning — after your attempt
Pressure reversal, wind-direction change, precipitation sequence and a corresponding mapped front support the inference. Temperature alone can change for other reasons.
Use a time series of pressure, temperature, humidity, wind and precipitation to infer a changing system. A single temperature drop is less diagnostic than a related set of observations and a mapped front. Forecast reasoning should state expected sequence and what could alter it.
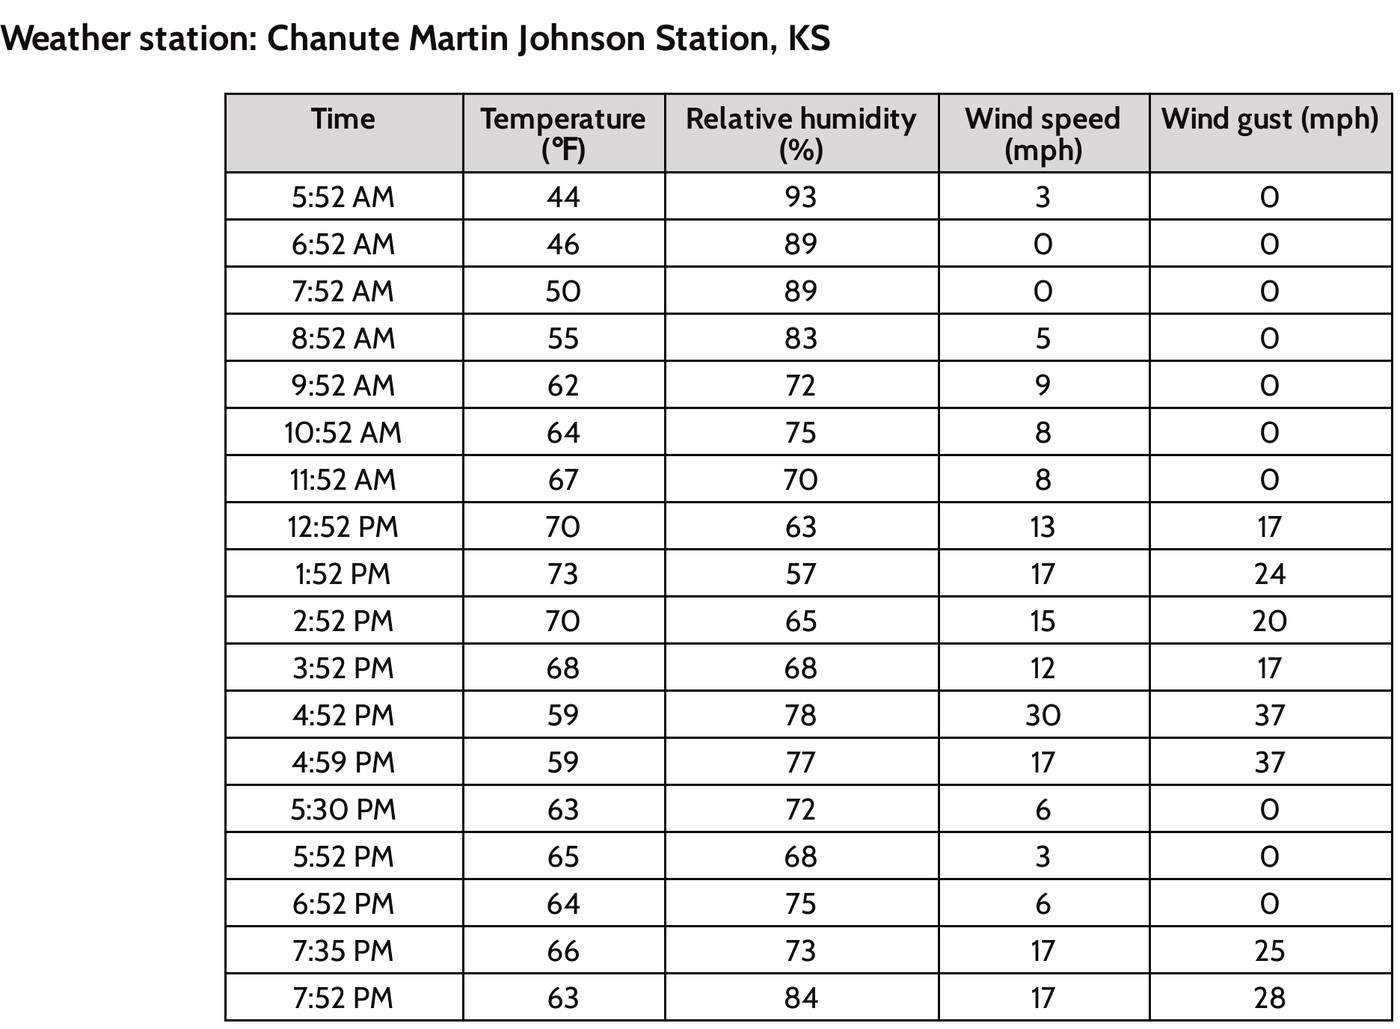
A passage with rain, wind shift and falling temperature may support a cold-front interpretation. Compare the map and timing to test the explanation instead of assigning the type from rain alone.
Pause and explain
What strengthens a front-passage inference beyond one temperature reading?
Check your reasoning after answering
Consistent wind, pressure, moisture and precipitation changes, linked to mapped movement.
Apply the whole unit · Interpret a front passage
Illustrative station series: before passage 22 °C with southerly wind and falling pressure; afterward 12 °C with northwesterly wind and rising pressure; rain occurs near the transition.
Your task
Propose a frontal interpretation, explain uplift and the sequence, and state an alternative or missing observation needed to test it.
What your response should show
- Use the supplied evidence accurately and label units or locations.
- Explain a physical mechanism or evidence-to-claim relationship.
- Show calculations or a clearly labeled model when the task calls for one.
- Identify a meaningful assumption, uncertainty, or competing explanation.
Response guidance — after your attempt
The combined pattern supports a cold-front passage, subject to map confirmation and timing. Cooler advancing air can lift warmer moist air. Rain alone is insufficient; compare regional observations and front positions before treating the inference as certain.
Scientific references and adapted source material
Parent / teacher teaching notes
Teach map symbols alongside a side-view sketch. Ask how wind, pressure and air-mass contrast relate; accept qualified alternatives with consistent evidence. Ask the learner to explain each visual label and causal step before calculating. Preserve a first model, attempt the changed independent case, then use feedback to revise. Diagrams state whether values are illustrative or observed. Selected OpenSciEd excerpts are middle-school source material used for supported foundations; the independent high-school explanations and supplements are not the complete OpenSciEd teacher editions or an endorsement.
The key idea
Air masses take on the temperature and moisture of where they form; cold fronts bring fast, intense weather while warm fronts bring slow, gentle weather; high pressure means sinking air and clear skies, and low pressure means rising air and storms.
Worked examples
Example 1
- A quick temperature drop and sudden gusty winds point to a fast-moving boundary, not a slow one.
- A short, intense burst of stormy weather (rather than hours of steady light rain) matches the steep slope of a cold front, which forces warm air upward quickly.
- Clearing skies and colder air right afterward fit too — a fresh, cold air mass has now taken over behind the front.
Example 2 · Worked application
- The advancing cold mass lifts warmer air.
- Lifting can cool moist air to condensation, producing clouds and precipitation.
A front does not guarantee identical weather everywhere.
Example 3
- It forms over land, far from any large body of water, so its moisture label is continental (c) — expect it to be dry.
- It forms at a high, cold latitude, so its temperature label is polar (P) — expect it to be cold.
- Combined, it's a continental polar (cP) air mass.
Example 4
- A cooler air mass replacing warmer air fits the temperature drop.
- The wind shift and precipitation add supporting evidence.
Example 5 · Find and fix the mistake
- Test the claim against the stated conditions: A front does not guarantee identical weather everywhere.
- Pressure systems influence patterns, but humidity, fronts, lifting and regional conditions also determine weather.
A front does not guarantee identical weather everywhere.
Example 6 · Reason from the visual evidence
- Trace the cool-air advance separately from the warmer-air uplift. The sloping boundary is a schematic cold front, not an identical geometry for every front.
- Available moisture, stability, local flow and timing vary. Lifting supplies a process, while those conditions influence whether and how precipitation develops.
Original cold-front cross-section with qualitative density contrast and uplift. Layer slopes and arrow lengths are not measured values. The text compares warm-front geometry separately and identifies the conditions omitted from this simple cross-section.
Avoid these mistakes
- A cold front does not guarantee the same kind of storm in every setting.
Check your understanding
A station records a wind shift, falling temperature and a band of rain passing through. What front model fits?
Discuss the answer
A passing cold front is plausible; a map and additional observations would test it.
Why does closely spaced pressure-contour information matter for wind prediction?
Discuss the answer
For the same interval and ground scale, closer isobars indicate a stronger pressure gradient, one force influencing wind. Rotation/friction also modify motion, and different isobar intervals must not be compared by spacing alone.
Return to the phenomenon
Return to the initial case. Why does a passing front change more than temperature? Revise your drawing or explanation using two named ideas and one stated limitation.
Compare explanations after your attempt
A front separates contrasting air masses and can lift moist air. Several linked station indicators support a passage inference, while source labels, pressure gradients and rotation/friction help explain the broader system.
What should we investigate next?
Which comparison would test a remaining uncertainty? State what you would change, keep comparable and measure.
Investigate, explain and revise
Complete the tasks after studying the visual parts. Keep the first model and explain a revision before consulting the guidance.
Activity 1 · Explain the opening case
Use this unit’s opening record, Parts 1–4 and your notebook model. No external equipment or text is required for this supplied-data route.
Your task
Return to the initial case. Why does a passing front change more than temperature? Revise your drawing or explanation using two named ideas and one stated limitation.
Success criteria
- Use two stated observations or conditions.
- Connect the mechanism to a labeled diagram or calculation.
- Identify what your original model missed.
- State a useful further test and a limitation.
Hint
Name the quantities and interactions before assigning a cause.
Response guidance — discuss after your attempt
A front separates contrasting air masses and can lift moist air. Several linked station indicators support a passage inference, while source labels, pressure gradients and rotation/friction help explain the broader system.
Activity 2 · Transfer to a changed case
Use the figures, captions and vocabulary in this unit; cover the worked answer.
Your task
Two maps have the same ground scale. Map A shows a 4 hPa change over 100 km; map B a 2 hPa change over 25 km. Compare pressure-gradient magnitudes and explain why neither gives a full wind direction alone.
Success criteria
- Use the stated measurements or conditions, with correct units.
- Connect the result to the physical mechanism or evidence relationship.
- Identify the assumption, model limit or further evidence requested.
Hint
Separate measured values, calculated results and model assumptions.
Response guidance — discuss after your attempt
A is 0.04 hPa/km; B is 0.08 hPa/km, twice as large. Actual wind also responds to rotation and friction, so pressure-gradient magnitude alone is not a complete directional forecast.
Words to know
- air mass
- A huge body of air that takes on a fairly uniform temperature and humidity from the surface it sits over for days at a time.
- front
- The boundary where two different air masses meet — usually the setting for a region's most active weather.
- air pressure
- The weight of the air pressing down on a given area, measured with a barometer.
- barometer
- An instrument that measures air pressure, useful for tracking whether weather is likely to clear or worsen.
Why wind spirals instead of blowing straight into a low
If Earth didn't rotate, wind would simply blow in a straight line from high pressure to low pressure. But Earth's rotation deflects moving air (and anything else moving over long distances, like ocean currents) to the right in the Northern Hemisphere and to the left in the Southern Hemisphere — an effect named after French scientist Gaspard-Gustave de Coriolis. That deflection is why wind spirals counterclockwise into a Northern Hemisphere low-pressure system rather than flowing straight toward its center, and why hurricanes and other storm systems always rotate the same direction in a given hemisphere.
The scientists who first mapped fronts as we know them
The very idea of a weather 'front' — language borrowed from World War I battle lines — was developed in the 1920s by Norwegian meteorologist Vilhelm Bjerknes and his research group, known as the Bergen School. Before their work, forecasters had no organized model for how storms formed; the Bergen School's insight that storms develop where a cold air mass and warm air mass collide, and that they follow a predictable life cycle, became the foundation of the modern forecasting techniques still taught in this lesson today.
Lake-effect snow: New York's own air-mass specialty
Upstate New York, especially areas like Buffalo, Syracuse, and the Tug Hill Plateau, experiences one of the most dramatic local examples of air masses interacting with geography: lake-effect snow. A cold, dry continental polar air mass sweeping across the relatively warm, unfrozen waters of the Great Lakes picks up huge amounts of moisture and heat from the lake surface, then dumps it as intense, highly localized snow bands as soon as the air mass reaches colder land again — sometimes burying one town in feet of snow while a town twenty miles away stays nearly dry.
Nor'easters: when ocean moisture meets cold coastal air
The Hudson Valley and greater New York region's most notorious storms are nor'easters — powerful coastal storms named for the northeasterly winds that blow into the coast on their leading edge. They form when a strong temperature contrast develops along the Atlantic coastline, often as cold continental air clashes with the relatively warm, moisture-rich air over the Gulf Stream, intensifying rapidly into a strong low-pressure system that can bring heavy snow, damaging wind, and coastal flooding — a direct real-world example of the fronts and pressure systems described in this lesson.
In the real world
Forecasters track approaching fronts and pressure changes days in advance — it's exactly how they can warn Westchester County of a cold snap or a rainy weekend before the first cloud appears.
Exit check
Why might a forecast use wind, pressure, moisture, and temperature together?
Check your explanation after answering
Each constrains a different part of the air-mass and circulation pattern. Together they support a stronger explanation than a single measurement, but the forecast remains uncertain.
Explain your reasoning without notes. If a key idea is missing, revisit the lesson and try again.
Reading Weather Patterns
Learning goals
- I can identify H, L, fronts, isobars, and station models on a weather map.
- I can use a barometric pressure trend to predict whether weather will improve or worsen.
- I can explain why weather in the mid-latitudes, including New York, generally moves from west to east.
Readings for this unit
Before this unit
Read graphs with timestamps, units and changing conditions.
Plan three teaching sessions: core explanation and Parts 1–2; Parts 3–4 with diagrams and reasoning checks; then the whole-unit application, worked examples, independent practice, and exit check. Read one part at a time, explain it without notes, and revisit any gap. Allow about 40–50 minutes per session; adjust after checking understanding. Trace and explain the labeled figures in each part. In the third session, complete the illustrated case and changed independent application; retain a corrected explanation rather than only an answer.
Start with something to explain
What makes a forecast specific enough to test?
Illustrative evidence case. Two supplied models agree a front is approaching but give different speeds. Later rain measurements can be compared with a forecast made for a stated window.
Notice and wonder
Record two observations using the stated quantities or relationships. Keep observations separate from possible causes. Write one question that a new measurement could help answer.
What makes a forecast specific enough to test?
Your first model
Draw the moving boundary and record a predicted measurable event, place and interval before viewing later records.
Build the language from the idea
- isobar
- A line on a weather map connecting points that all have the same air pressure; closely packed isobars mean stronger winds.
- station model
- A small cluster of symbols and numbers on a weather map that packs in one location's temperature, wind, and cloud cover at a glance.
- meteorologist
- A scientist who studies the atmosphere and uses weather data to make forecasts.
- prevailing westerlies
- The belt of winds in the mid-latitudes, including New York, that generally blows from west to east, steering most weather systems that way.
- relative humidity
- A ratio comparing actual vapor conditions with the saturation reference at the current conditions, normally expressed as a percent.
- dew point
- The temperature associated with saturation for the moisture present under the stated pressure conditions.
A weather map can look like a tangle of lines and symbols until you know the code, and then it turns into a readable picture of the sky. Meteorologists — the scientists who study the atmosphere and forecast its behavior — mark centers of high and low pressure with a bold H or L, draw fronts as lines studded with triangles (cold) or semicircles (warm), and connect all the places that share the same air pressure using curving lines called isobars.
Those isobars do more than label pressure — their spacing reveals the wind. Where isobars are packed tightly together, pressure is changing sharply over a short distance, and that steep 'pressure hill' drives strong winds, just as a steeper slope makes a ball roll faster. Where the isobars spread far apart, the pressure change is gentle and the air stays calm. So without a single wind measurement, one glance at how crowded the isobars are tells a forecaster where it's blowing hardest.
To pack even more into one spot on the map, meteorologists use a station model — a compact cluster of symbols and numbers that reports one location's temperature, wind speed and direction, cloud cover, and more, all at a glance. Behind those tidy symbols stands a small army of instruments: a thermometer for temperature, a barometer for pressure, an anemometer for wind speed, a hygrometer for humidity, and a rain gauge for precipitation, backed up by Doppler radar and satellites watching storms from above.
Here's the pattern forecasters in New York lean on every single day: in the mid-latitudes, weather generally marches from west to east, carried along by a broad belt of winds called the prevailing westerlies and by the fast, high-altitude river of air known as the jet stream. Because of this, a meteorologist can look at what's soaking Ohio today and make a solid prediction about what Westchester County will get tomorrow. Weather doesn't teleport — it travels, and here it mostly travels one direction, which is what makes short-range forecasting possible at all.
The other half of forecasting is watching how things change over time, and pressure is the giveaway. If the barometer has been falling steadily for a few hours, air is rising, clouds are building, and a storm is probably on the way; if it's been climbing, sinking air is clearing the skies. Combine the two habits — reading what's happening upwind and tracking whether the pressure is rising or falling — and you can do exactly what professional forecasters do: turn a snapshot of right now into a reliable guess about tomorrow.
Weather describes short-term atmospheric conditions; a forecast estimates how those conditions may develop. A station measurement is local, while radar and satellite observations cover wider areas. Compare their different strengths before combining them.
Read a weather map as a snapshot with a stated observation time. A pressure trend or moving front needs several maps to establish motion. Missing data and model simplifications limit predictions, especially over longer intervals.
A forecast expressed as probability does not promise the same result everywhere. Evaluate forecasts over many events rather than one memorable success or failure. Record what happened, the location and time interval, then compare with what was actually predicted.
Build your understanding
Plan three teaching sessions: core explanation and Parts 1–2; Parts 3–4 with diagrams and reasoning checks; then the whole-unit application, worked examples, independent practice, and exit check. Read one part at a time, explain it without notes, and revisit any gap. Allow about 40–50 minutes per session; adjust after checking understanding.
Part 1 · Decode a weather map before forecasting
A station model places weather measurements around a station location using a stated convention. Temperature and dew point are different quantities: dew point is associated with saturation for the moisture present. The wind shaft extends toward the direction the wind comes from; barbs encode speed in the map’s stated units. Pressure may be coded on a reference map, so use its decoding rule rather than inventing missing digits. Here the pressure is already written in full. Each full wind barb represents 10 knots, so the two full barbs give 20 knots; one knot is one nautical mile per hour, about 1.852 km/h. The observation time, location and key are part of the data, because weather evolves.
Read the visual model
Read the numbers as explicitly decoded temperature, dew point and pressure. The two full barbs are only interpretable with the stated wind-speed convention.
Why must the time stamp and decoding key accompany a station symbol before comparing forecasts?
Visual reasoning — after your attempt
They establish when observations apply and how symbols/units are interpreted. A later forecast cannot be checked fairly against an unspecified time or invented code convention.
Read the key, units, time stamp and spatial scale. A station model compresses temperature, dew point, pressure, wind and other observations into symbols. Use the provided decoding convention for pressure rather than inventing missing digits. A map represents observations or analyses for a particular time, not every later condition.
Two maps six hours apart allow a movement comparison only if their definitions and scales are compatible. Mark what is observed and what is an interpreted boundary.
Pause and explain
Why is the observation time essential for a forecast comparison?
Check your reasoning after answering
Weather changes; evidence from different times must be ordered to infer movement and development.
Part 2 · Connect humidity, cooling and cloud formation
Relative humidity compares the actual water-vapor amount or vapor pressure with the saturation reference under the current conditions. In the supplied fixed-volume model, 8 units compared with a warm saturation reference of 16 give 50% RH; the same 8 units compared with a cooler reference of 8 give 100%. Cooling changes the reference relationship, not a literal container that becomes full. Continued cooling under suitable conditions can lead to condensation. Actual saturation values and volume/pressure changes need the appropriate reference data; these invented units teach the ratio rather than a universal temperature table.
Read the visual model
Keep actual vapor at 8 while changing the saturation reference. Compare like quantities within the same fixed-volume model.
Why does equal relative humidity at two different temperatures not guarantee equal vapor amount?
Visual reasoning — after your attempt
Their saturation reference can differ. Equal fractions of different reference amounts can correspond to different actual vapor amounts.
Relative humidity relates actual vapor to the saturation value under current conditions. Cooling can raise relative humidity without adding vapor. Dew point identifies a temperature associated with saturation for the moisture present. Cloud formation depends on cooling/lift and condensation conditions, not a literal container of air becoming full.
Air cooled toward its dew point can condense vapor into droplets. Two samples with equal relative humidity can have different vapor amounts if their temperatures differ.
Pause and explain
Does equal relative humidity imply equal water-vapor amount at different temperatures?
Check your reasoning after answering
No. The saturation reference depends on temperature.
Part 3 · Extract trends and evaluate uncertainty
Forecast models use initial observations and mathematical process descriptions to evolve a represented system. Different initial estimates or model approximations can yield different movement speeds even when both suggest front passage. A location 120 km ahead would be reached after 3 h at 40 km/h or 4 h at 30 km/h in this constant-speed model. The agreement supports the broad event, while the disagreement identifies timing uncertainty. Check newer observations, front evolution and model performance rather than treating one line as a guaranteed appointment.
Read the visual model
The curves share an initial position and direction but differ in slope. The vertical axis is travel distance, not temperature or precipitation probability.
At a place 60 km ahead, what arrival times do the two supplied models imply?
Visual reasoning — after your attempt
1.5 h at 40 km/h and 2 h at 30 km/h, assuming steady speed along the stated path. Actual movement can evolve.
A falling pressure trend, changing wind and approaching front together can support a forecast. Numerical models evolve a representation from initial observations; incomplete measurements and approximations create uncertainty. Compare multiple indicators and distinguish an expected outcome from a guarantee.
If model runs disagree about a front’s speed, arrival timing has uncertainty even when all suggest passage. Report a reasonable range supported by the runs, not an exact minute chosen for convenience.
Pause and explain
What does agreement on front passage but disagreement on speed imply?
Check your reasoning after answering
The event may be supported while its timing remains uncertain.
Part 4 · Test a forecast against later observations
Verification compares a forecast made in advance with later observations for its stated location, time window and variable. If the original forecast was 4 mm of rain and 2 mm occurred, it overestimated by 2 mm for that window. An updated forecast for another interval is a new prediction, not evidence that the original one was correct. Multiple events can reveal average error and variability; one successful or unsuccessful case does not establish universal model skill. Keep the original criteria and compare alternatives on matched windows and measurements.
Read the visual model
The first two bars share a verification window. The update is shown as a distinct forecast, not a replacement for the archived original.
Why would comparing the original six-hour forecast with a later twelve-hour accumulation be unfair?
Visual reasoning — after your attempt
The intervals differ, so they measure different outcomes. Verify the stated six-hour window with matching observations before assessing or comparing skill.
State the forecast, location, interval and measurable outcome before checking it. Compare temperature, precipitation or timing with the prediction; a successful broad claim can still miss an important detail. Repeated verification helps identify patterns of model error and whether an update improves performance.
Forecasting some rain tomorrow is different from forecasting more than 20 mm between two stated hours. Decide which criterion was actually promised before scoring the result.
Pause and explain
Why should forecast verification use the original stated criterion?
Check your reasoning after answering
Changing the criterion afterward can make an incorrect or vague prediction appear successful.
Apply the whole unit · A forecast and verification notebook
Illustrative forecast: frontal passage between 14:00 and 18:00, temperature falls at least 5 °C. Observed passage is 17:00 and temperature falls from 24 to 16 °C.
Your task
Evaluate timing and temperature separately, show the change, and explain why one successful case does not establish universal reliability.
What your response should show
- Use the supplied evidence accurately and label units or locations.
- Explain a physical mechanism or evidence-to-claim relationship.
- Show calculations or a clearly labeled model when the task calls for one.
- Identify a meaningful assumption, uncertainty, or competing explanation.
Response guidance — after your attempt
17:00 falls within the window; cooling is 8 °C, exceeding the threshold. Both stated criteria are met. Repeated cases, other variables and different conditions are needed to characterize accuracy; retain what was predicted before observing the result.
Scientific references and adapted source material
Parent / teacher teaching notes
Use a short observation log or the supplied case. Ask for decoding, physical mechanism and verification separately so symbol reading is not mistaken for forecasting understanding. Ask the learner to explain each visual label and causal step before calculating. Preserve a first model, attempt the changed independent case, then use feedback to revise. Diagrams state whether values are illustrative or observed. Selected OpenSciEd excerpts are middle-school source material used for supported foundations; the independent high-school explanations and supplements are not the complete OpenSciEd teacher editions or an endorsement.
The key idea
Weather maps use H, L, fronts, and isobars to show pressure patterns; because mid-latitude weather generally moves west to east, watching pressure trends and what's happening upwind predicts what's coming next.
Pressure Change Rate
rate = ΔP ÷ Δt
ΔP is the change in barometric pressure (mb) and Δt is the elapsed time (hours); a fast, large drop often signals a stronger storm approaching.
Worked examples
Example 1
- Falling pressure means the air above that location is rising rather than sinking.
- Rising air cools as it climbs, and cooling air causes water vapor to condense into clouds.
- More clouds and rising air together typically lead to an increasing chance of precipitation, so conditions are likely to turn cloudier and stormier.
Example 2 · Worked application
- Several observations support an approaching disturbed-weather system.
- Check radar, fronts and updated forecasts before predicting exact timing or severity.
A forecast is conditional and updated with new evidence.
Example 3
- In the mid-latitudes, including New York, weather systems are generally steered by the prevailing westerlies from west to east.
- A storm 500 miles to the west is roughly upwind of Westchester County in that general flow.
- Since systems typically take a day or two to travel that distance, Westchester should likely prepare for that storm within the next day or so.
Example 4
- Average speed=180/6=30 km/h.
- Future speed or direction can change, so straight extrapolation is an assumption.
Example 5 · Find and fix the mistake
- Test the claim against the stated conditions: A forecast is conditional and updated with new evidence.
- Weather is short-term; climate concerns distributions over long periods.
A forecast is conditional and updated with new evidence.
Example 6 · Reason from the visual evidence
- The curves share an initial position and direction but differ in slope. The vertical axis is travel distance, not temperature or precipitation probability.
- 1.5 h at 40 km/h and 2 h at 30 km/h, assuming steady speed along the stated path. Actual movement can evolve.
Original illustrative constant-speed front trajectories for timing comparison. They are not an operational forecast ensemble or a calibrated probability interval. The record distinguishes event agreement from uncertainty about timing.
Avoid these mistakes
- One weather map cannot by itself establish a front's speed or direction over time.
Check your understanding
A front moves 180 km between maps taken 6 h apart. Find its average speed and one forecasting limit.
Discuss the answer
30 km/h over the measured interval; a later arrival estimate needs continued observations.
Why should forecasts be evaluated across many events?
Discuss the answer
Repeated matched-event verification reveals systematic error, variability and skill under different conditions. One successful event can reflect chance or a limited condition and does not establish universal forecast performance.
Return to the phenomenon
Return to the initial case. What makes a forecast specific enough to test? Revise your drawing or explanation using two named ideas and one stated limitation.
Compare explanations after your attempt
Keys and time stamps make map observations interpretable. Model timing can differ, and fair verification uses the archived prediction and a matching observed variable/window rather than a broad claim that weather changed.
What should we investigate next?
Which comparison would test a remaining uncertainty? State what you would change, keep comparable and measure.
Investigate, explain and revise
Complete the tasks after studying the visual parts. Keep the first model and explain a revision before consulting the guidance.
Activity 1 · Explain the opening case
Use this unit’s opening record, Parts 1–4 and your notebook model. No external equipment or text is required for this supplied-data route.
Your task
Return to the initial case. What makes a forecast specific enough to test? Revise your drawing or explanation using two named ideas and one stated limitation.
Success criteria
- Use two stated observations or conditions.
- Connect the mechanism to a labeled diagram or calculation.
- Identify what your original model missed.
- State a useful further test and a limitation.
Hint
Name the quantities and interactions before assigning a cause.
Response guidance — discuss after your attempt
Keys and time stamps make map observations interpretable. Model timing can differ, and fair verification uses the archived prediction and a matching observed variable/window rather than a broad claim that weather changed.
Activity 2 · Transfer to a changed case
Use the figures, captions and vocabulary in this unit; cover the worked answer.
Your task
A front is 90 km from a town. Model A gives steady motion 30 km/h and model B 45 km/h. Calculate the two arrival times and define a fair observation-based timing check.
Success criteria
- Use the stated measurements or conditions, with correct units.
- Connect the result to the physical mechanism or evidence relationship.
- Identify the assumption, model limit or further evidence requested.
Hint
Separate measured values, calculated results and model assumptions.
Response guidance — discuss after your attempt
A gives 3 h and B 2 h. Record the forecast issue time, defined passage indicator/location and predicted intervals, then compare with later observations using the original criteria. Changing criteria after the event undermines verification.
Activity 3 · Interpret an actual station record
Use the credited historical OpenSciEd station table in Part 3 and the source-evidence practice question.
Your task
Using the actual station record, calculate the changes from 3:52 PM to 4:52 PM in temperature (°F and °C), relative humidity (percentage points) and wind speed (mph). For a temperature difference, Δ°C = Δ°F × 5/9. Explain what these simultaneous changes support and why they do not by themselves prove a particular front, exact hailfall location or complete cause.
Success criteria
- All changes use later minus earlier and retain correct units.
- Temperature-difference conversion and percentage-point distinction are correct.
- The inference is limited to the stated record and identifies evidence needed for a causal explanation.
Hint
Keep the original source units and compare the same columns. For a temperature change, only the scale factor 5/9 is needed.
Response guidance — discuss after your attempt
Temperature changes from 68 to 59 °F: −9 °F, equivalent to −5 °C. Relative humidity changes from 68% to 78%: +10 percentage points, not a 10% relative increase. Wind speed changes from 12 to 30 mph: +18 mph. The observations support a changing atmospheric situation at the named station; mapped front/pressure, wind direction, moisture and event-location evidence would help test causes. A humidity increase alone does not prove more water vapor, because saturation conditions change with temperature.
Words to know
- isobar
- A line on a weather map connecting points that all have the same air pressure; closely packed isobars mean stronger winds.
- station model
- A small cluster of symbols and numbers on a weather map that packs in one location's temperature, wind, and cloud cover at a glance.
- meteorologist
- A scientist who studies the atmosphere and uses weather data to make forecasts.
- prevailing westerlies
- The belt of winds in the mid-latitudes, including New York, that generally blows from west to east, steering most weather systems that way.
- relative humidity
- A ratio comparing actual vapor conditions with the saturation reference at the current conditions, normally expressed as a percent.
- dew point
- The temperature associated with saturation for the moisture present under the stated pressure conditions.
The jet stream: a river of air that steers — and sometimes 'gets stuck'
High above the surface, a fast-moving ribbon of air called the jet stream forms where cold polar air meets warmer air to the south, and it's the real engine behind the 'west to east' movement of mid-latitude weather. The jet stream doesn't flow in a straight line — it bends into large, wavy loops called Rossby waves. When these waves get unusually large and slow down, a weather pattern can get essentially 'stuck' in place for days or weeks, called a blocking pattern, which is often the underlying cause of unusually long heat waves or extended cold snaps.
From storm proverbs to supercomputers — and why forecasts still fail
Before the telegraph, weather warnings could only travel as fast as the storm itself, so 'forecasting' relied mostly on folklore and local sky-watching. Starting in the 1870s, telegraph networks let observers report conditions upwind instantly, creating the first real storm warning systems. Today's forecasts come from supercomputers running numerical models based on physics equations — but meteorologist Edward Lorenz discovered in the 1960s that the atmosphere is a chaotic system, where a tiny, unmeasurable difference in starting conditions (his famous 'butterfly effect') can snowball into wildly different outcomes, which is exactly why forecasts reliably get less accurate the farther out they predict.
How Doppler radar 'sees' a tornado forming
Weather radar doesn't just show where rain is falling — modern Doppler radar measures the Doppler shift in the radio waves it bounces off raindrops, revealing whether that precipitation (and the air carrying it) is moving toward or away from the radar station, and how fast. By detecting a tight, tornado-shaped pattern of air rotating rapidly in opposite directions right next to each other inside a storm, meteorologists can issue a tornado warning even before a funnel cloud is ever visually spotted, buying critical extra minutes for people to take shelter.
A twice-a-day balloon launch, all over the planet
Every single day, at almost exactly the same two moments (routinely near midnight and noon Greenwich time), roughly 900 weather stations across the globe simultaneously release radiosonde balloons — instrument packages that radio back temperature, humidity, pressure, and wind data as they rise through the entire atmosphere. This coordinated, worldwide snapshot, repeated twice daily for decades, is one of the main real-world data sources meteorologists feed into the computer models used to build the station models and pressure maps described in this lesson.
In the real world
Airline pilots, farmers deciding when to harvest, and weekend campers all check the same station-model-packed weather maps to plan around what's coming.
Exit check
How could falling pressure and observations west of New York help a forecast?
Check your explanation after answering
Falling pressure may signal an approaching system. Many regional systems move generally west to east, so upstream observations can help predict changes. Wind, moisture, fronts, and local conditions are also needed; the pattern is not a guarantee.
Explain your reasoning without notes. If a key idea is missing, revisit the lesson and try again.
Problem 1
Answer and explanation
Condensation
As water vapor rises and cools, it condenses into tiny liquid droplets, which cluster together to form clouds.
Problem 2
Answer and explanation
Solar energy supports evaporation; gravity drives precipitation falling and downhill flow.
Sunlight is an energy source, not itself a force. Gravity moves water downward while solar energy supports phase changes and circulation.
Problem 3
Answer and explanation
Sublimation
Sublimation is the process where ice or snow turns directly into water vapor without first becoming liquid water. Along with melting, it can shrink a snowpack over time.
Problem 4
Answer and explanation
Maritime tropical (mT)
It forms over water, so it's maritime (moist); it forms near the equator, a warm region, so it's tropical (warm). Together: maritime tropical (mT).
Problem 5
Answer and explanation
A warm front; it typically brings gradually thickening clouds and a longer period of light, steady precipitation.
The gentle slope and slow-gliding motion of warm air over cold air describes a warm front, which moves slowly and spreads lighter precipitation over a longer stretch of time, unlike the fast, steep, intense weather of a cold front.
Problem 6
Answer and explanation
An anemometer
An anemometer is the instrument specifically designed to measure wind speed.
Problem 7
Answer and explanation
Winds are likely getting stronger.
Isobars packed closely together indicate a bigger pressure difference over a short distance, and bigger pressure differences drive stronger winds.
Problem 8
Answer and explanation
Increasing clouds and a chance of showers ahead of the front, then a brief but intense burst of wind and rain (or thunderstorms) as the front passes, followed by clearing skies and noticeably colder temperatures behind it.
The below-average pressure reading signals rising air and an increased chance of clouds and precipitation even before the front fully arrives. As the fast-moving, steep cold front itself passes through, expect a short, intense period of gusty wind and rain or storms. Once it moves past, the region comes under the influence of the fresh, cold air mass behind it, so skies clear and temperatures drop.
Problem 9
Answer and explanation
By combining the falling-pressure trend, which signals rising air and a likely storm, with knowledge of what's currently happening in states to the west, since weather generally travels west to east in the mid-latitudes.
A falling barometer at the local station already hints that stormier weather is developing overhead. Because mid-latitude weather, including New York's, is steered generally from west to east by the prevailing westerlies, the meteorologist can also look at current conditions a state or two to the west and expect Westchester to experience something similar within a day or so — combining both clues sharpens the forecast.
Problem 10
Answer and explanation
300 mm
800 − 500 = 300 mm.
Problem 11
Answer and explanation
Inputs and outputs are rates, so the figures only mean something over a stated interval — 800 mm in a year is very different from 800 mm in a month. The area matters because a depth of rainfall converts to a volume only when multiplied by the catchment area. Without both, the numbers cannot be compared between places or used to size a reservoir.
Response criteria
- State a scientifically accurate conclusion.
- Show the data, mechanism, or calculation that supports it.
- Include units, conditions, or limits where relevant.
Problem 12
Answer and explanation
Net input is 12 m³/day, so storage gains 60 m³ and reaches 310 m³. Lake area/shape or a volume-level relationship is needed for height change.
Subtract 40−28 = 12 m³/day.
Multiply by five days to obtain 60 m³ and add to 250.
Distinguish volume from height and request geometry.
Response criteria
- Use the stated measurements or conditions, with correct units.
- Connect the result to the physical mechanism or evidence relationship.
- Identify the assumption, model limit or further evidence requested.
Problem 13
Answer and explanation
Measure reflected/absorbed energy and temperature while controlling material, moisture, mass, airflow, and exposure. Several properties affect temperature.
Problem 14
Answer and explanation
Right of northward motion is east, and right of eastward motion is south. Coriolis modifies existing motion in the rotating Earth frame; pressure-gradient or other forces initiate the wind. The complete wind also depends on friction and other forces.
Right of northward motion is east, and right of eastward motion is south. Coriolis modifies existing motion in the rotating Earth frame; pressure-gradient or other forces initiate the wind. The complete wind also depends on friction and other forces.
Response criteria
- Use the stated measurements or conditions, with correct units.
- Connect the result to the physical mechanism or evidence relationship.
- Identify the assumption, model limit or further evidence requested.
Problem 15
- loses energy to space
- expands as pressure drops with height
- touches cold ground
- gains moisture
Answer and explanation
expands as pressure drops with height
Expanding air does work and its temperature falls, which is why cloud forms aloft.
Problem 16
Answer and explanation
Unsettled weather is likely — increasing cloud, strengthening wind and probably rain — because a falling barometer means a low-pressure system is approaching. Rising air in the low cools and condenses, producing cloud and precipitation, and the pressure gradient between the low and surrounding higher pressure drives wind. The speed of the fall indicates how vigorous the system is.
Response criteria
- State a scientifically accurate conclusion.
- Show the data, mechanism, or calculation that supports it.
- Include units, conditions, or limits where relevant.
Problem 17
Answer and explanation
A is 0.04 hPa/km; B is 0.08 hPa/km, twice as large. Actual wind also responds to rotation and friction, so pressure-gradient magnitude alone is not a complete directional forecast.
Calculate 4/100 and 2/25 in matched units.
Compare 0.08 with 0.04: factor two.
Include rotation/friction and distinguish pressure-gradient force from wind.
Response criteria
- Use the stated measurements or conditions, with correct units.
- Connect the result to the physical mechanism or evidence relationship.
- Identify the assumption, model limit or further evidence requested.
Problem 18
Answer and explanation
6 hours
180 / 30 = 6 hours.
Problem 19
Answer and explanation
The station with the higher dew point has far more water vapour in the air, so it feels humid and sticky, and sweat evaporates poorly. The one with a low dew point feels dry despite the identical thermometer reading. Dew point measures the actual moisture content, which is why it describes comfort better than relative humidity alone.
Response criteria
- State a scientifically accurate conclusion.
- Show the data, mechanism, or calculation that supports it.
- Include units, conditions, or limits where relevant.
Problem 20
Answer and explanation
A gives 3 h and B 2 h. Record the forecast issue time, defined passage indicator/location and predicted intervals, then compare with later observations using the original criteria. Changing criteria after the event undermines verification.
A gives 3 h and B 2 h. Record the forecast issue time, defined passage indicator/location and predicted intervals, then compare with later observations using the original criteria. Changing criteria after the event undermines verification.
Response criteria
- Use the stated measurements or conditions, with correct units.
- Connect the result to the physical mechanism or evidence relationship.
- Identify the assumption, model limit or further evidence requested.